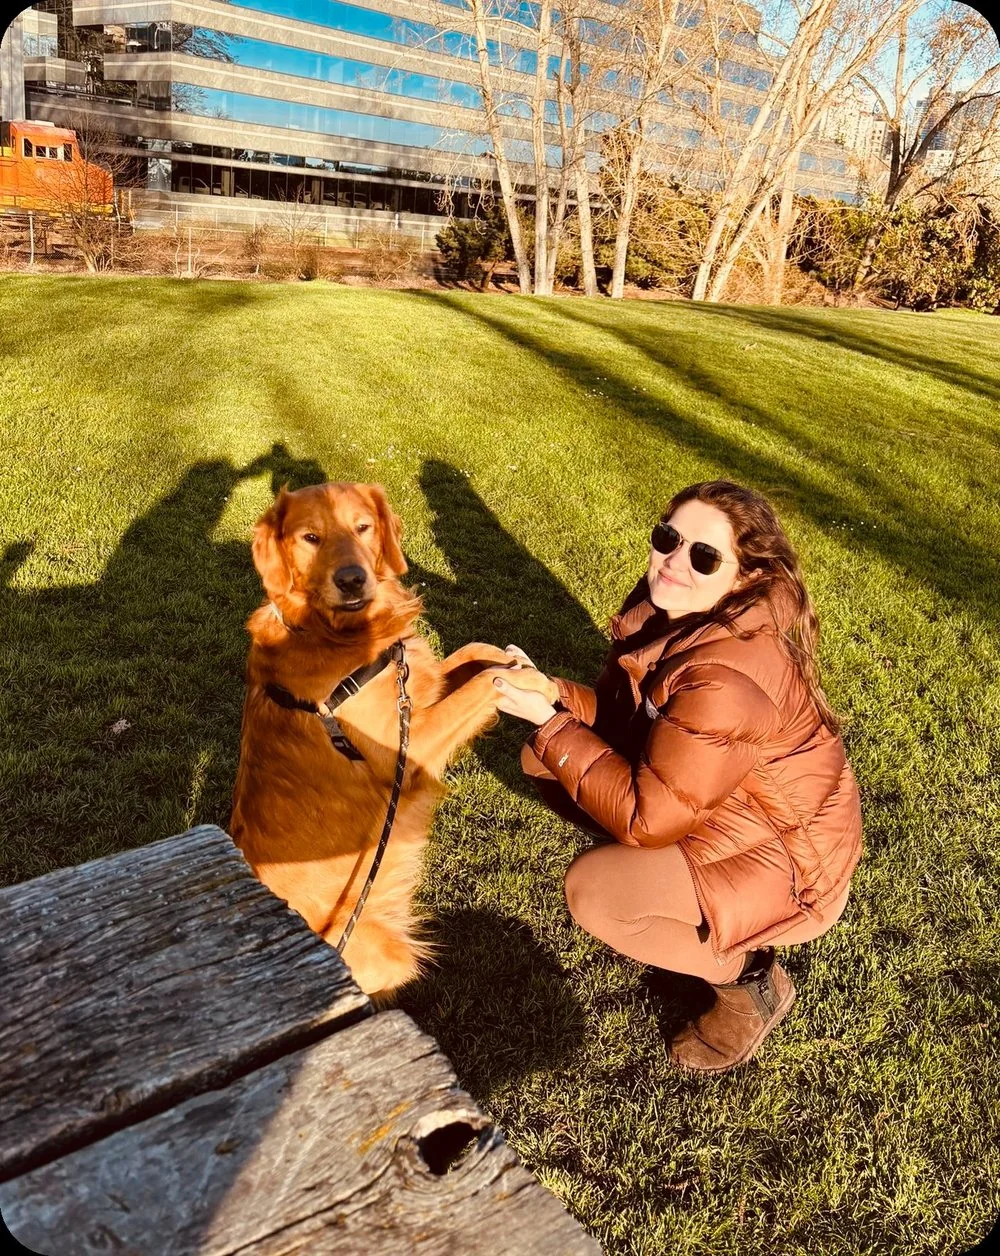
Experiencing Tech, Art, and Design in Seattle, WA (with Blue 🐕).
Senior Product Designer at Amazon, working on air cargo operations. Previously at Alaska Airlines and IBM.
About
I’m Brazilian/American who grew up in a diverse cultural environment. That plurality made me passionate about how new interaction models and technologies shape the way people relate to each other, to objects, and to ideas. I also deeply care about self-awareness and being present.
Designing disruption management for Amazon’s air cargo network
🔒 Under NDA, so I can only share limited information
Scope
Workflows and product strategy
Role
Senior Product Designer, sole designer
Surface
AI-assisted internal operations tool
Status
Ongoing
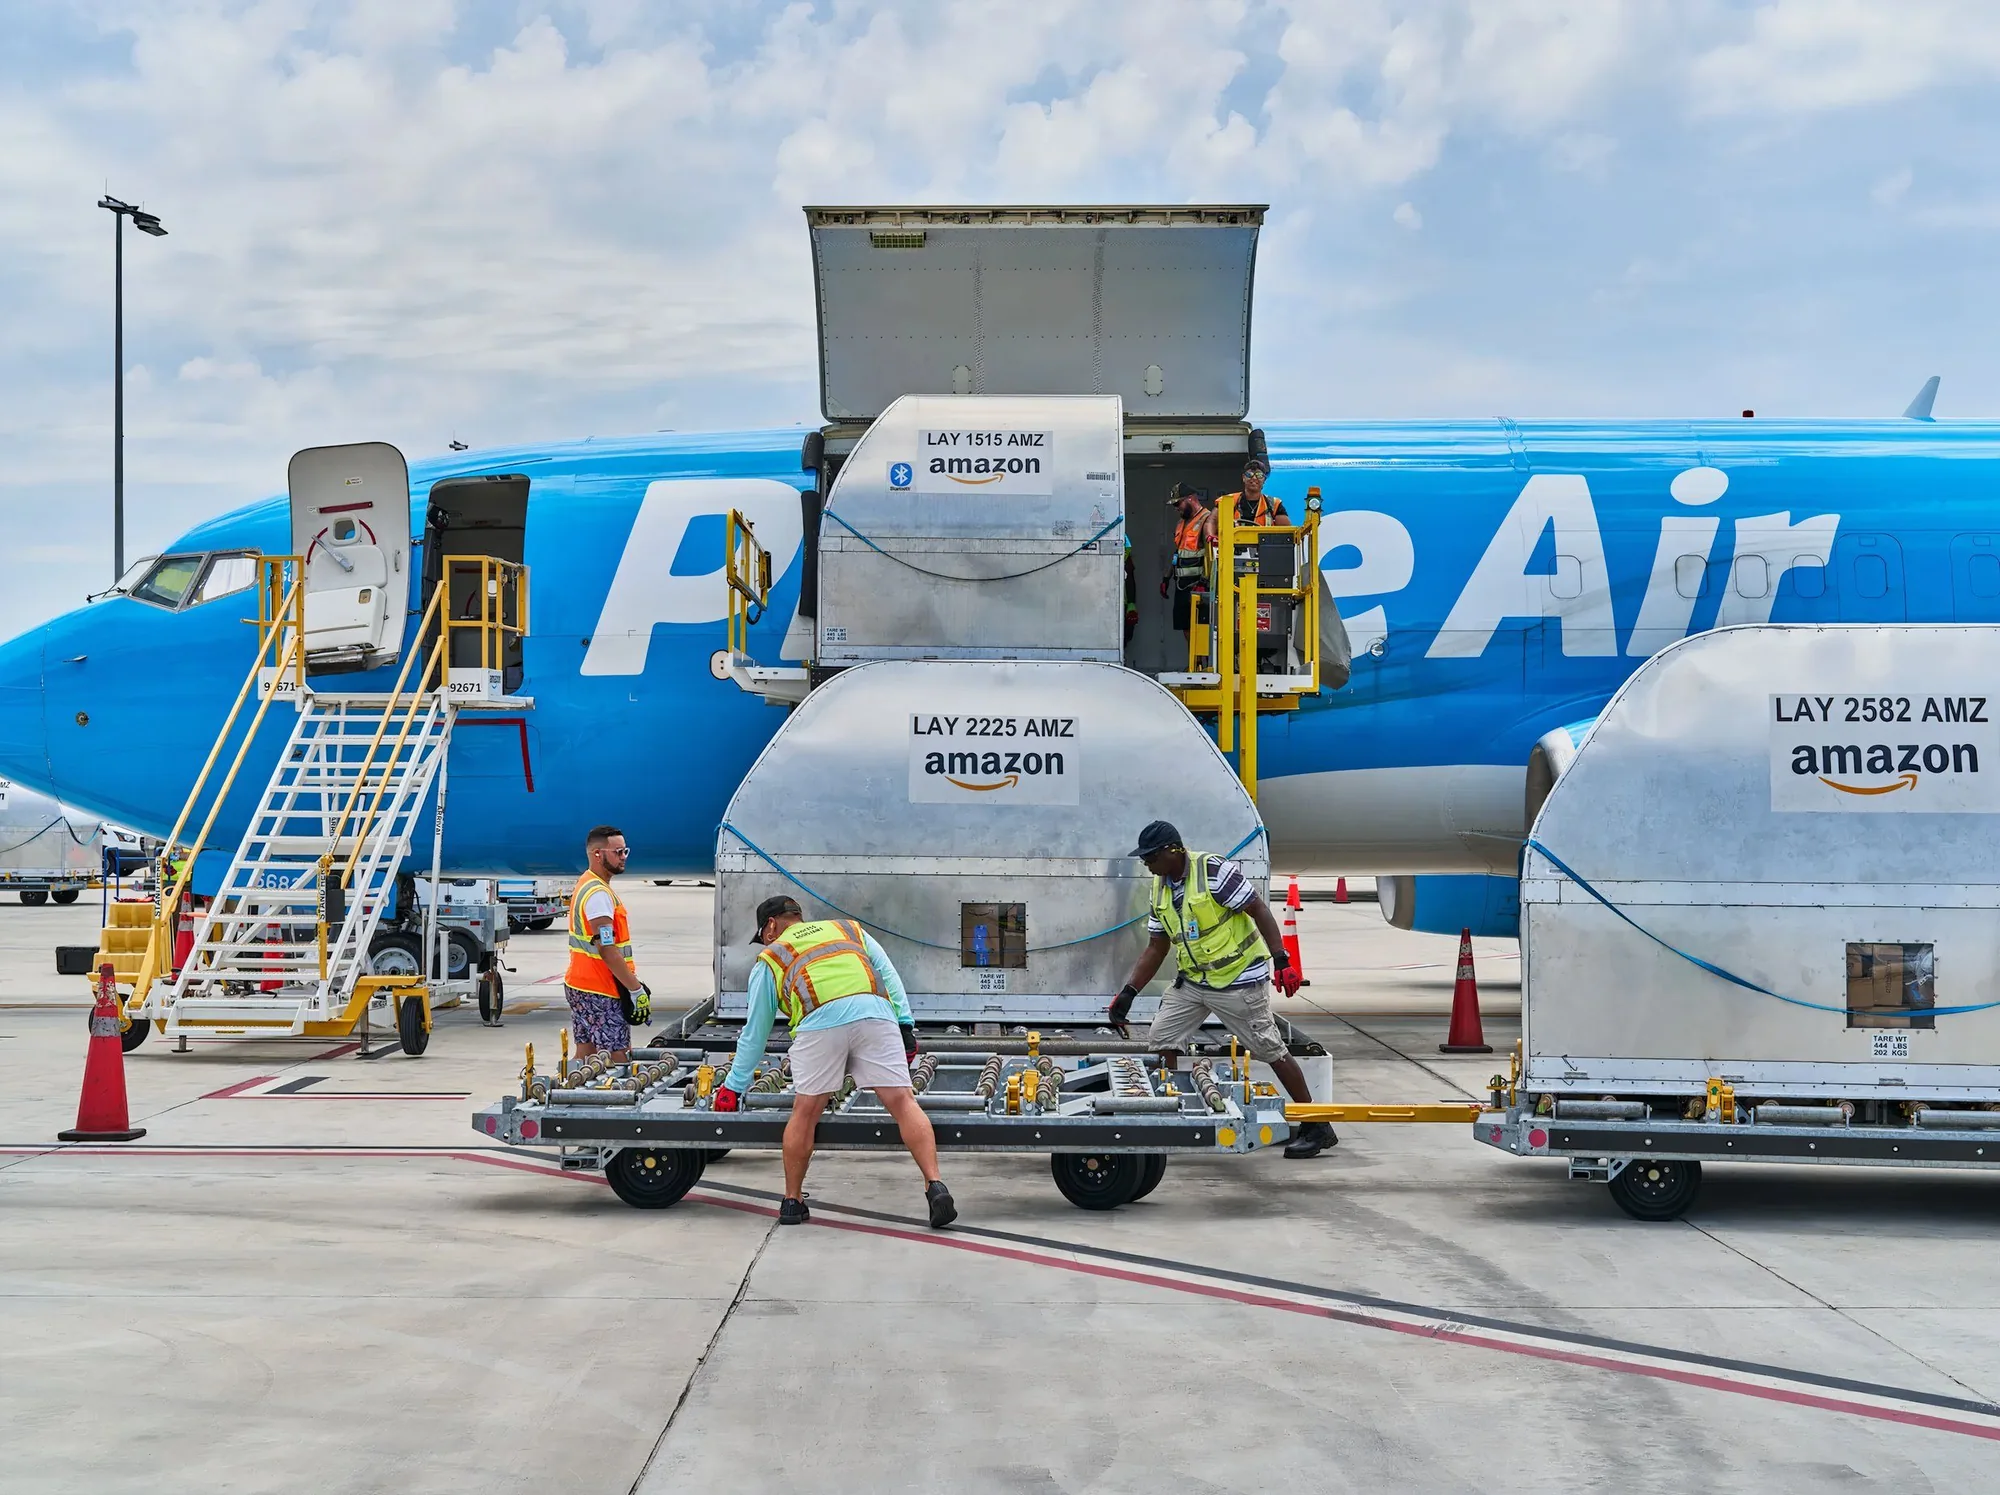
When a flight is disrupted, a network operator has minutes to decide how to recover, and every option moves packages, aircraft and crews somewhere else in the network. I’m the sole designer on the tool they use to make that call, and a co-author of its 2027 product strategy.
1Designer, from field research to product strategy.
6Stages in the framework I created for every recovery.
3Levels of maturity: optimize, recommend, automate.
The problem
Recovery was manual and scattered. One decision meant checking several systems, copying data between them, and coordinating over chat, inside a window that keeps shrinking. There was no single view of the situation, no standard way of working, and no measure of how long a recovery took or whether it was the right call.
What I found
I went to the control center, sat with the operators, and mapped every recovery action end to end: the trigger, the people, each step, each tool, each judgment call.
The same waste in every workflow. Redundant data entry, copy and paste between tools, decisions made in side conversations.
The hard part comes after detection. Spotting a disruption is the start. The time and the risk are in deciding what to do and carrying it out.
Every team had its own language. Same work, different tools, norms and logic.
The framework
So I gave the work one shape. Every recovery, whatever caused it, moves through six stages:
Replan, Coordinate and Implement run as a loop until every party agrees on a plan. It started as my proposal and is now used by design, engineering and operations. It became the common language across teams and the structure of the product: each stage is a place to remove steps, add a check, or let the system act.
The strategy
Each recovery action is an independent building block that matures on its own timeline:
Optimize. Make the manual workflow fast, short, and in one place.
Recommend. The system suggests the best response and shows why.
Automate. The system executes. The operator owns the exceptions.
We start with the actions that happen most often, cost operators the most effort, and protect the most deliveries.
What I design
One action instead of a chain. The right response surfaces in the operator’s view when a disruption is identified.
Checks built in. Constraints operators used to cross-reference by hand are validated inside the action.
Communication included. The messages that follow a decision go out as part of the workflow.
AI that earns trust. It proposes, explains, and leaves the judgment call with a person.
How we measure
One metric first: handling time, from disruption identified to recovery executed. It gives every workflow a baseline and makes each release accountable.
What I’m building now
Fragmentation is the root problem, so the next step is a single workspace: an AI-powered, role-aware workspace that serves as an integration layer, unifying the 12 tools operators bounce between today. It shows each role what matters for their part of a recovery, pulls the data from the systems underneath, and lets them act without leaving the page.
Where it is going
An integrated command center where routine recoveries run themselves and operators spend their attention on the complex, high-impact calls.
This work is confidential. Screens, internal names and metrics are intentionally left out. I’m happy to walk through the process in conversation.
Designing the new generation of Alaska Airlines MxHub: dashboard built for maintenance technicians
🔒 Under NDA, so I can only share limited information
Scope
0 – 1
Role
Lead Product Designer
Team
MxHub Team: 1 PM, 12 Engineers
Time
11 months
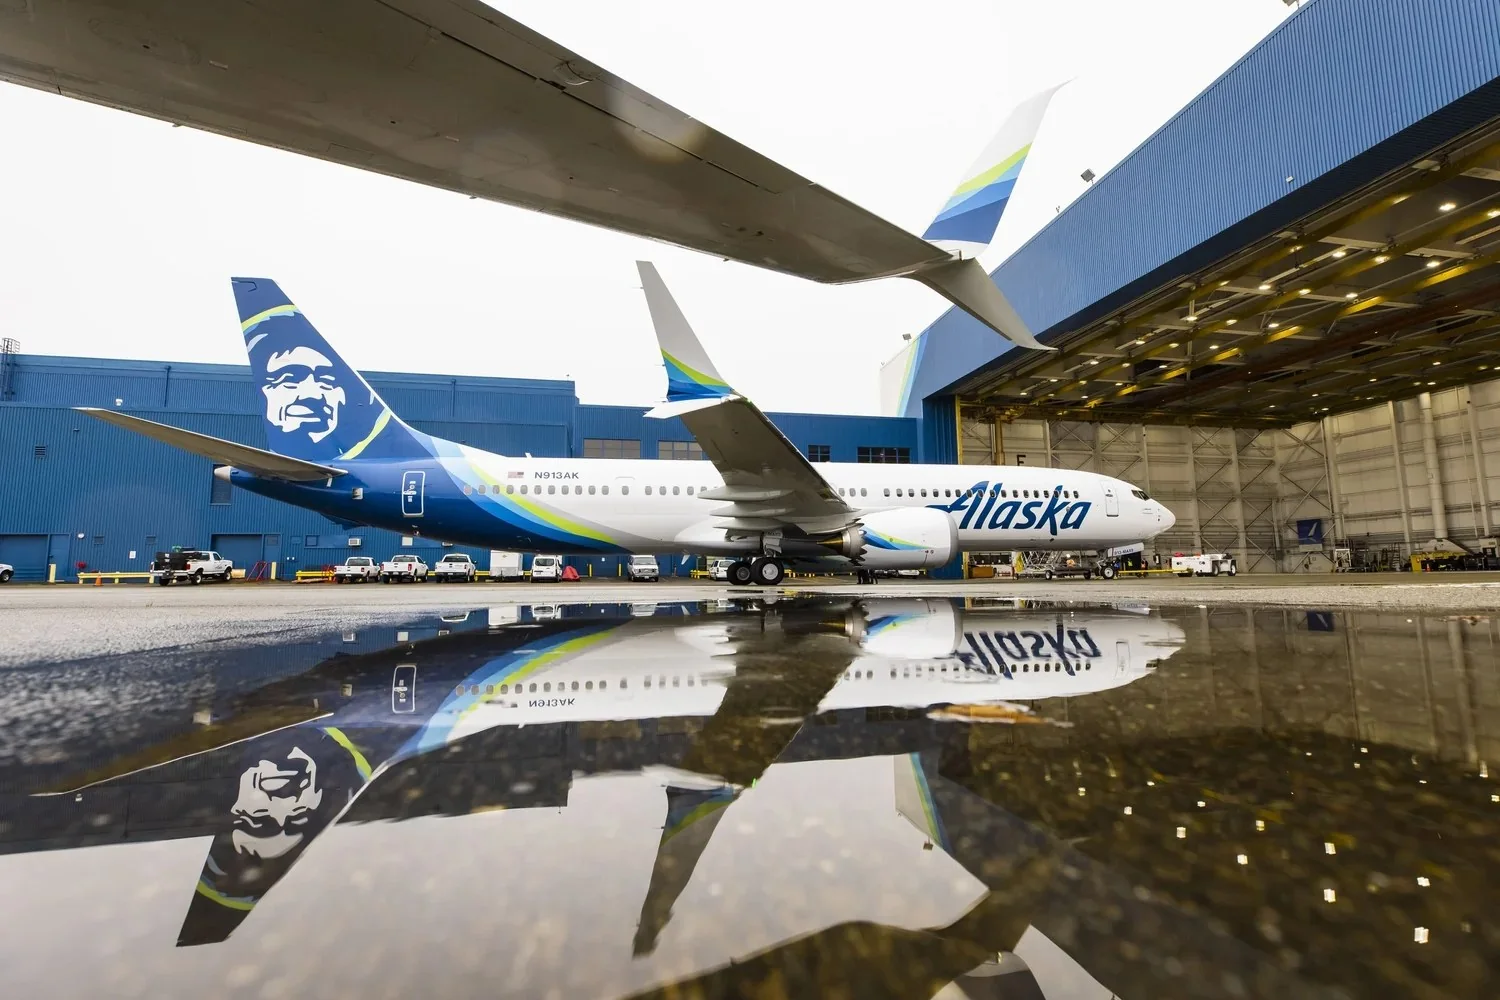
At the time, Alaska Airlines powered over 400,000 trips every year with a fleet of 315 aircraft, supported by nearly 1,000 maintenance technicians. When we launched MxHub, a source of information application for maintenance, technicians were transitioning from a legacy system that had served them for over 27 years.
As demands grew, not only in app usage but also in terms of ever-evolving products and features, our maintenance system was ripe for a comprehensive overhaul. Notably:
We transformed aircraft maintenance into the modern era by consolidating multiple tools into one mobile-friendly solution that emphasized efficiency and accessibility. Our situational awareness app provided real-time aircraft status, task management features, and seamless access to crucial information by integrating with key systems at Alaska Airlines.
Alaska’s brand and design system for internal tools had gone through multiple reskins and updates in visual language; we wanted the navigation surfaces to reflect a polished, professional feel consistent with the Alaska Airlines ecosystem.
So, in 2023, my team gathered at Alaska Airline’s Seattle office to rethink MxHub.
3 → 1Tasks per workflow, overall. The oil flow went from 4 tasks to 1.
125,000Estimated technician hours saved per year.
~1,000Technicians moved off a 27-year-old legacy system.
A focus on efficiency and safety
The company’s top core value is safety, and from a business perspective, time efficiency - because every minute an airplane spends on the ground between flights directly impacts revenue. As a member of the Maintenance and Engineering team, I was directly focused on these critical values, which involved coordination with various stakeholders from different parts of the company.
With these principles in mind, we envisioned MxHub with the long term goal of enabling technicians to complete all maintenance requirements smoothly in one solution. We wanted to provide the most glanceable dashboard view, including all aircraft information, allowing technicians to quickly and easily parse real time data. We believed this would lead to more efficient maintenance operations, with improved task preparation and execution, and fewer missed details.
Challenges in design innovation in aviation
As many who work in large organizations can relate, designing and building the product isn’t the most impressive task: it’s obtaining buy-in and alignment from your internal stakeholders and partner teams. By nature, organizations tend to lean conservatively with product changes, especially in the aviation industry, because introducing new updates can lead to increased risk and potentially negative business metrics. Due to this, we embarked on an internal roadshow across the company, presenting our changes to partners including sister product teams, design systems, and user research.
Also, this project marked a renewed effort to introduce MxHub, following previous attempts by other teams that did not meet expectations. I stepped in as the third designer, inheriting a challenging situation with strained relations between stakeholders and the ITS team. My role was pivotal in resetting expectations and rebuilding trust to move the project forward.
Our turnaround can be attributed to two main factors:
My self-awareness put me in a learning mindset, which helped me create a design strategy. I began by creating raw frameworks with various concepts to deeply engage stakeholders and encourage them to think beyond their established mental models. More importantly, rather than simply asking what they wanted—knowing they had a preconceived idea—I encouraged them to articulate why they disliked the new concepts I created. This was extremely important for deeply understanding the reasons behind their choices and identifying key points for user validation.
In addition to standard slide deck presentations, we employed some creative tactics to demonstrate the delta and improvements between the old and new design.
What the research showed
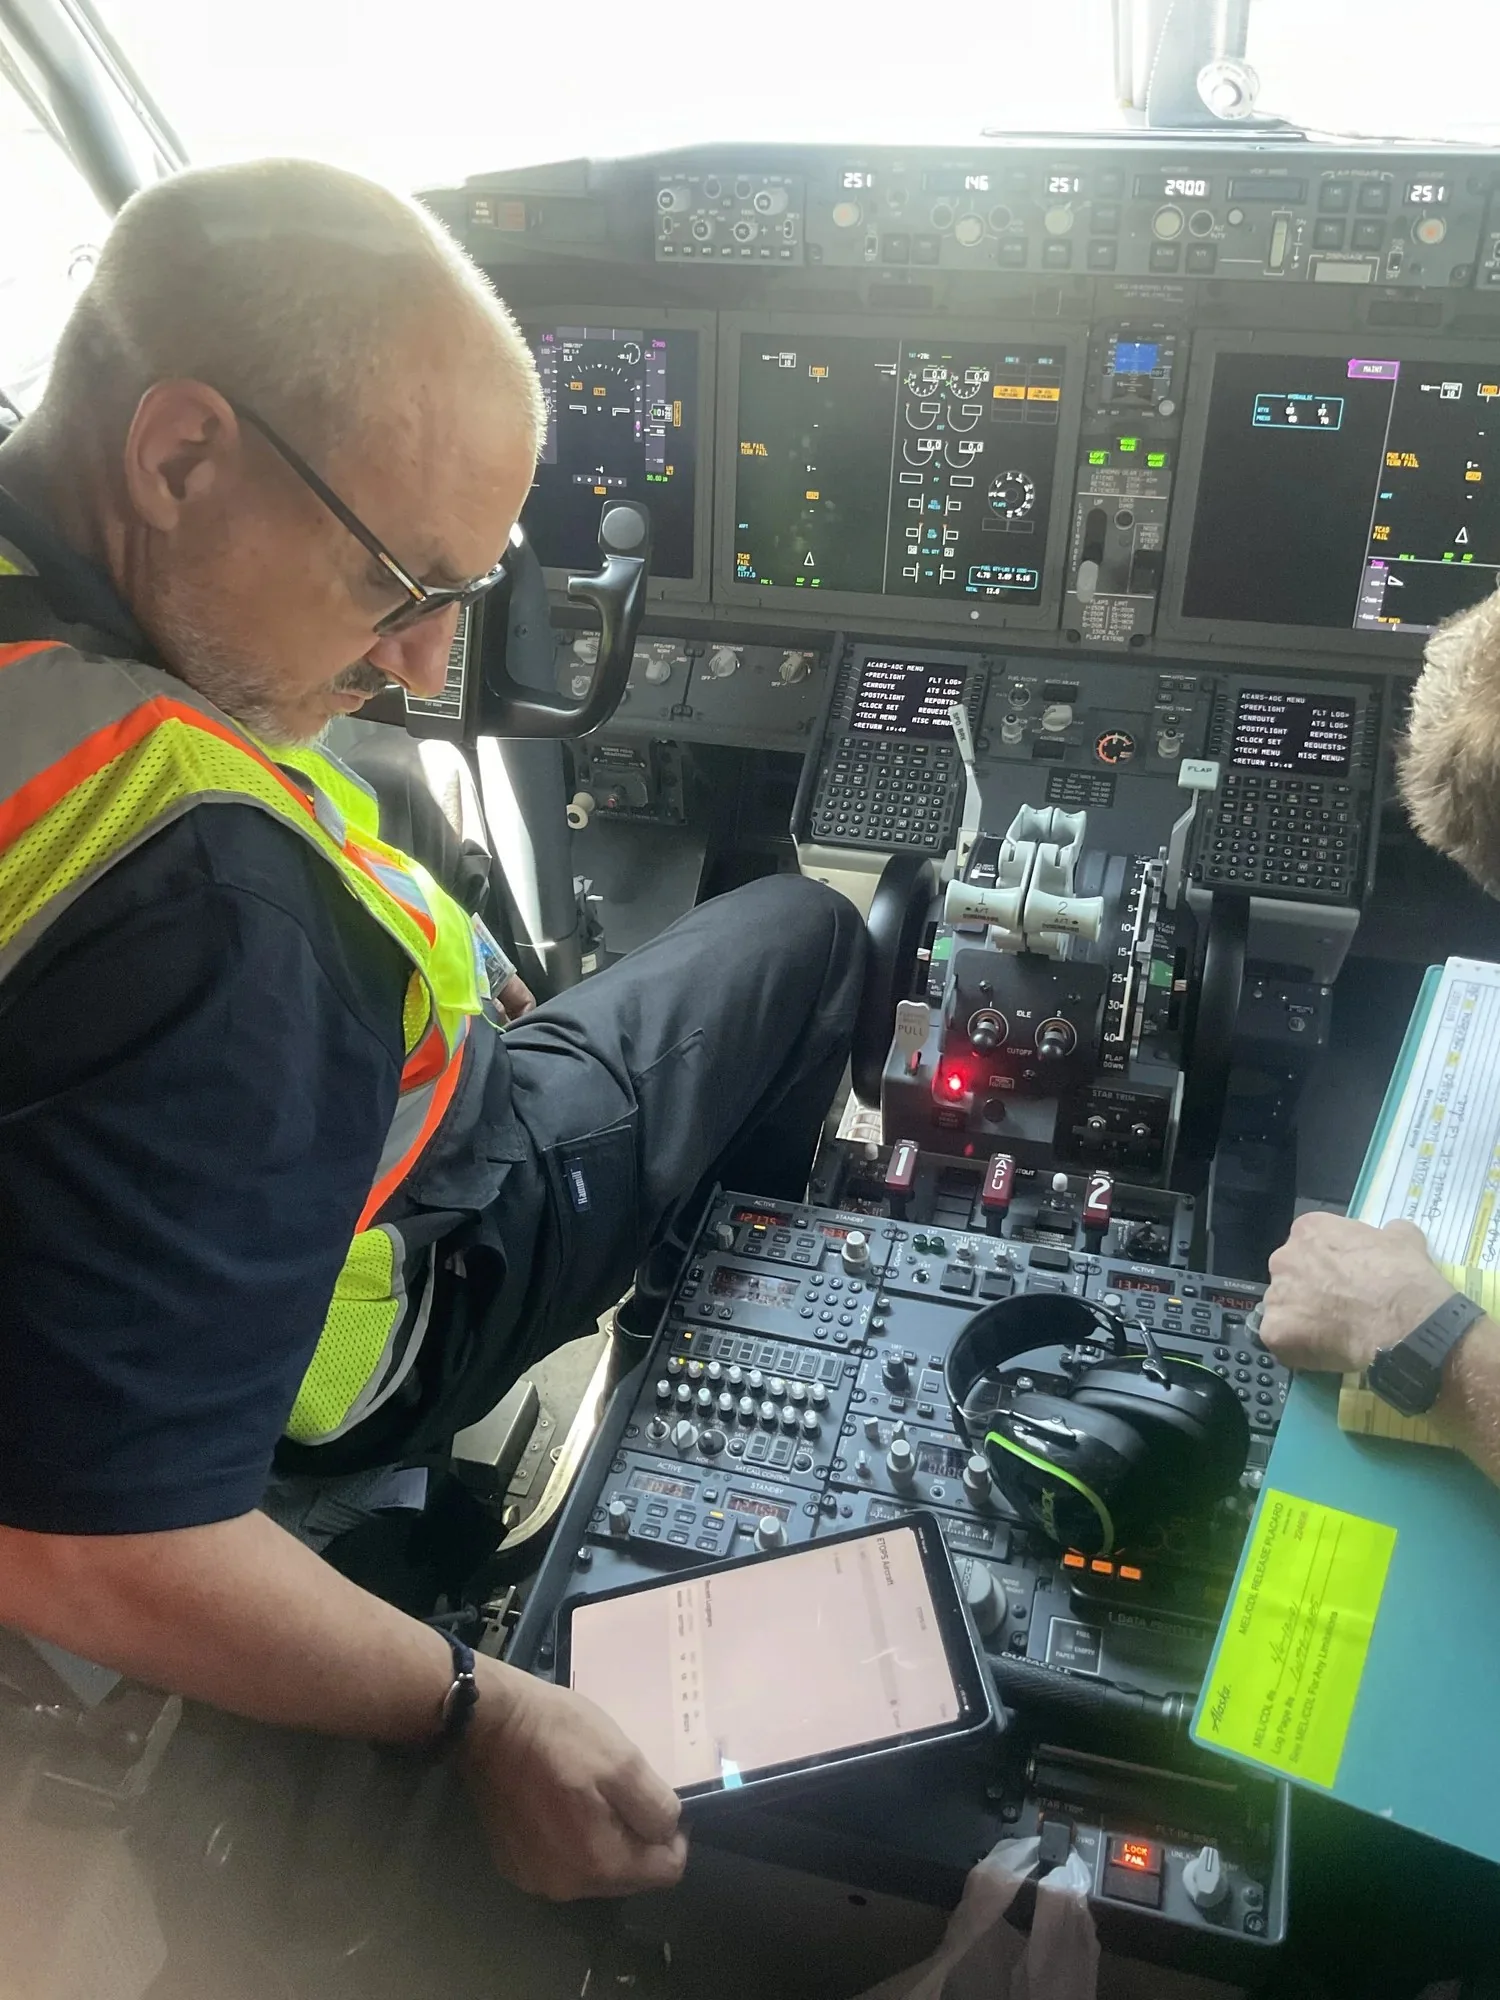
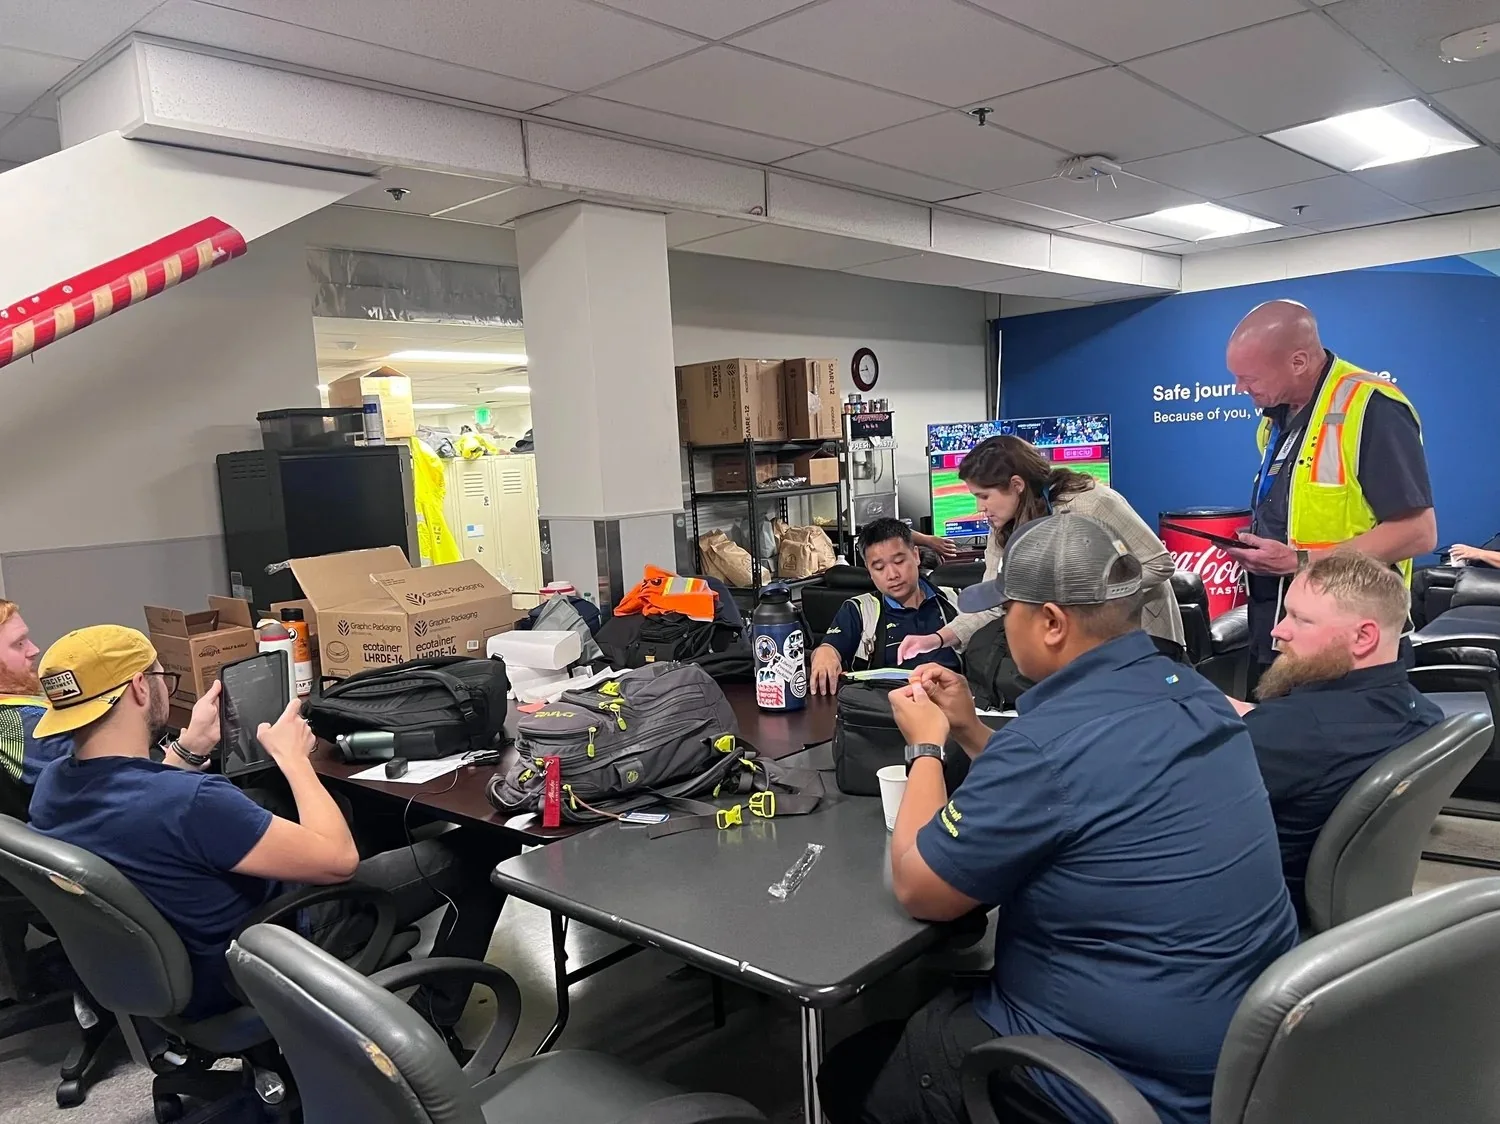
I started by reviewing the previous team’s documentation and mapping every technician workflow across the tools they used, to understand how each system connected to the others and to the physical environment. Then I went to the stations and shadowed technicians through their day.
Fragmented tools. The work was spread across separate systems and spreadsheets, each with its own visual language, so every task meant switching context.
Duplicate tasks. Technicians only brought paper to the tarmac. They wrote everything by hand at the aircraft and typed it again into desktop tools back in the ready room, which added friction and risk of error.
No real-time data. Coordination between leads, technicians and controller teams ran over busy radio channels and aging phones, so people waited or repeated themselves.
Information overload. Technicians live in a world of acronyms. I ran tree tests with around 40 sticky notes of tasks, acronyms and resources, built around one scenario: “You’re prepping for the day, what do you look for first?” The answers showed that their workflow should drive the information architecture.
Not only a UI problem, also a systemic one
Leadership had a strong vision for the product, but it had been formed without user feedback and without the constraints of an iPad in the field. The first concept mirrored the legacy tools: dense, colourful, and forcing technicians to bounce between the dashboard and task screens. I designed a version of that idea on purpose, not to ship it but to use it as a conversation tool, and to show the gap between the vision and what technicians needed on the tarmac.
That opened the door to a different mental model, progressive disclosure: give technicians the overview first, and let them dive into detail only when the task calls for it. It reframed the brief as one question: how might we design an information architecture that mirrors technician workflows, surfacing the right information at the right time?
Design
I explored four layout patterns with stakeholders as raw frameworks, with no colour or icons: cards, split view, tiles, and expanded rows. Stripping the visuals moved the conversation from what the dashboard should look like to how it should support the work.
Usability tests on the first iteration showed too much detail in each tile, no clear hierarchy between scheduled and unscheduled tasks, and deferred items taking up space nobody needed up front. The next iteration put more aircraft on each screen for a glanceable read of the day, and grouped tasks by category with status icons so they could be scanned quickly.
The biggest shift was in the workflows themselves. MxHub stopped mirroring the connected systems and started sending information to them proactively. In the oil flow, four separate tasks became one: instead of remembering every step, a technician gets a prompt about what needs attention and makes a decision. That lowers cognitive load in the conditions where it matters most, in the rain, in a rush, moving around an aircraft.
Accessibility shaped the visual system. Technicians use the app under direct sunlight on the tarmac, in ready rooms, and inside aircraft with inconsistent light, so I tuned light and dark modes for each and designed tiles around dynamic type sizes.
Rollout and results
We released in phases, starting with small stations and moving to mid-size and large hubs, with a feedback loop at each step to fix bugs and validate the product before the next one.
Oil flow: from 4 tasks to 1. Logbook flow: from 4 tasks to 2. Overall: from 3 tasks to 1.
An estimated 125,000 technician hours saved per year (0.5 hour per day, per technician, across 250 working days and about 1,000 technicians on day and swing shifts).
The VP of Maintenance and Engineering became an advocate for design, joined our weekly syncs, and the M&E team began joining station visits to meet technicians.
What I learned
Optimize systems, not just screens. I learned to zoom out beyond the UI and look at the problem systemically.
Build trust through collaboration. Advocacy came from delivering consistently and being transparent. The more I brought stakeholders in, the more support I had for better design decisions.
Ask the hard questions, earlier. At the start I held back so I wouldn’t cause friction. Asking better questions with real curiosity brought clarity and alignment, and I wish I had done it sooner.
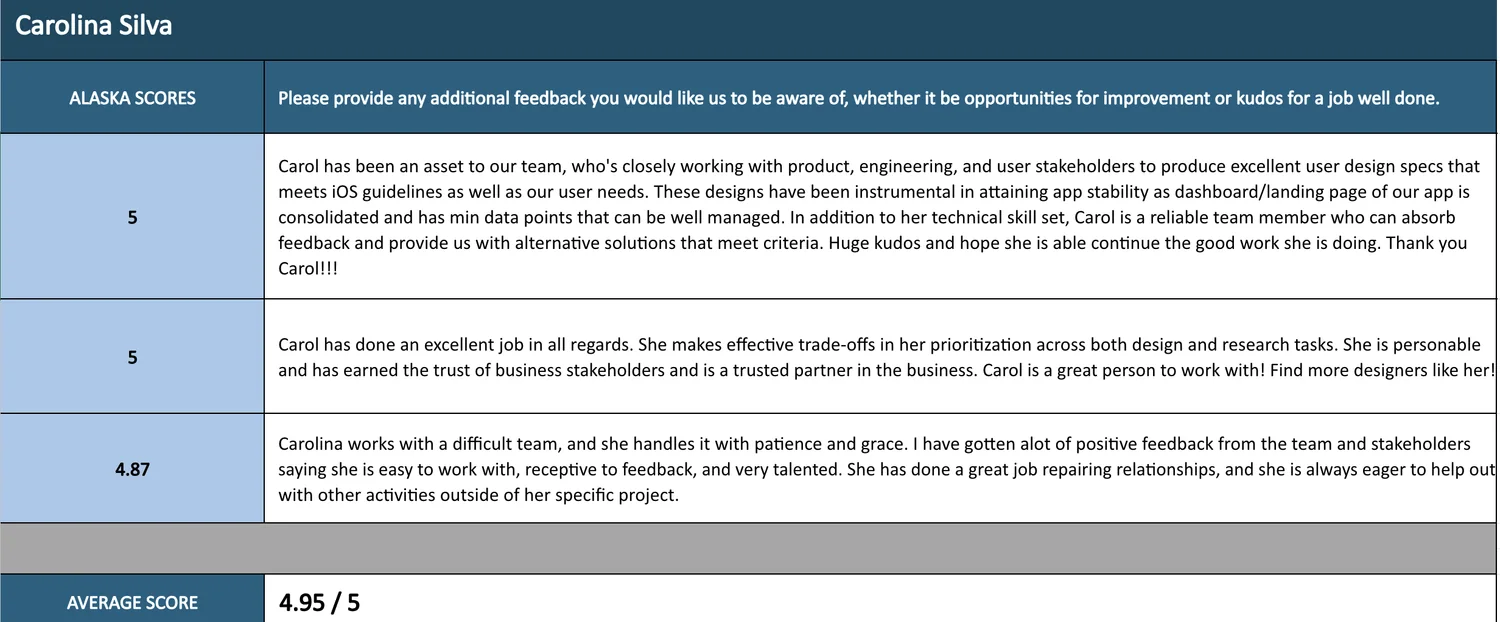
What my colleagues say about me 🙂
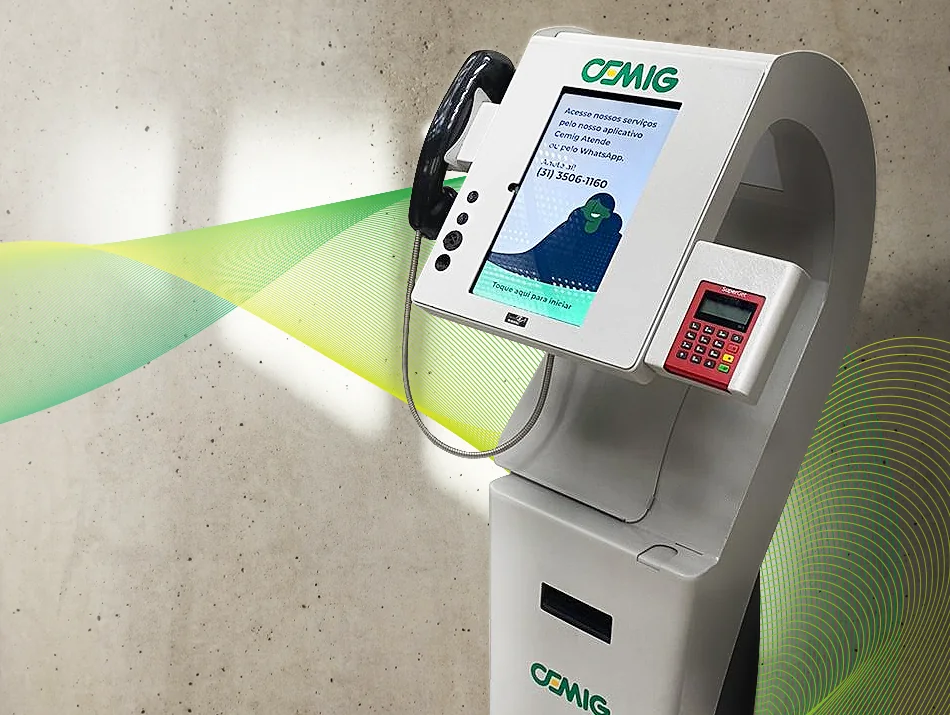
IBM – Cemig Kiosk Stations Redesign
⚡️ This is the story of how I made a positive impact on everyday life in Minas Gerais, Brazil.
Scope
Full redesign
Role
Lead Designer, kiosk stations
Team
2 Designers, 1 PM, 5 Engineers
Time
1 year
⚡️ To comply with my non-disclosure agreement, I have omitted and obfuscated confidential information in this case study.
Overview
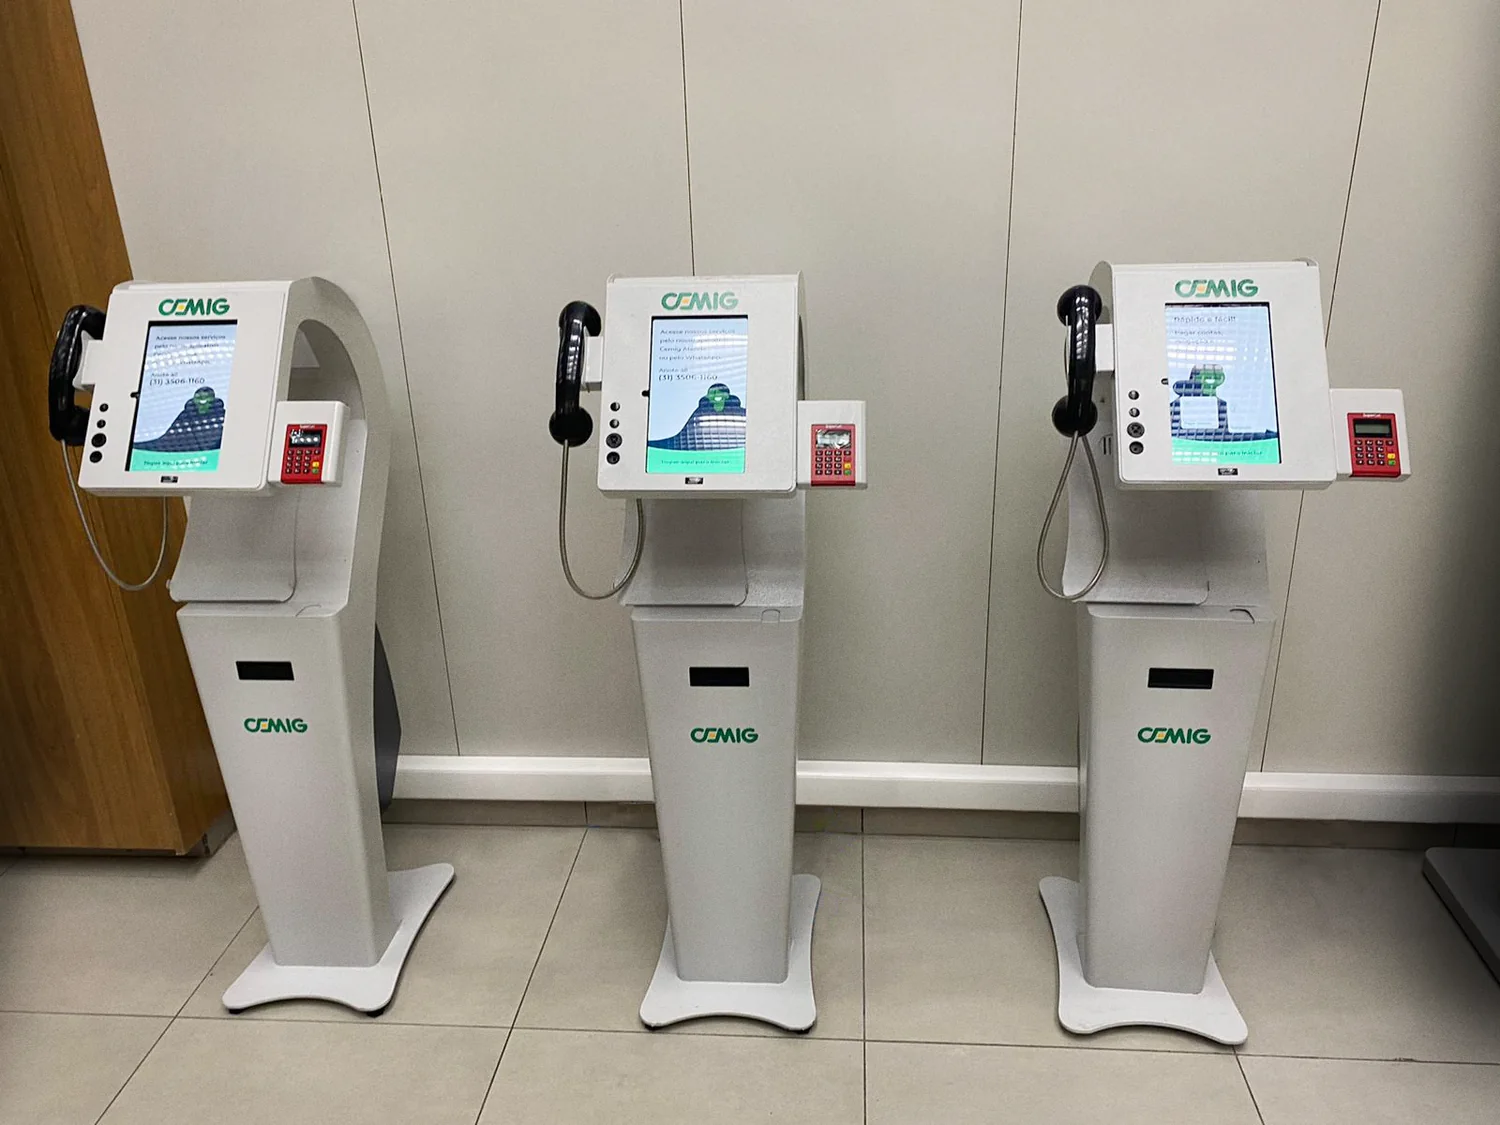
After extensive quantitative and qualitative research and a better understanding of the Cemig ecosystem — one of the largest power generators and distributors in Brazil — with key stakeholders, we embarked on a 1-year redesign of the kiosk stations to transition customer interaction over a digital and self-service channel to help with its digital transformation of customer care approach.
Within one year, Cemig relaunched 20 new features across 800+ kiosk stations for over 8.6 million customers. I was the leading designer working on these new features with a team of one more designer, a product manager, and five engineers.
This was IBM’s largest project in Latin America at the time, and included migrating the company’s systems and databases to IBM Cloud.
+68%Median number of active customers since launch.
+40%Conversion rate on Pagar conta (pay bills).
−31%Lines in the agencies.
The problem
By looking at the individual user journeys and flows, we uncovered issues where users were wrongfully converting, getting lost in the kiosk experience, and abandoning at a rate of 1,140 users per month (a 24% loss). Because the user’s experience of the application was slow, overwhelming, and complex, there were long lines at the various kiosk locations, and users needed help from employees to resolve the issues.
Goals
Users: Autonomy over their account with Cemig whenever they want
Business: Increase engagement and retention of customers
Product: Ensure reliability and consistent innovation
We observed that the kiosk’s users were potential beginners, unfamiliar with the technology. Thus, if they did not understand the first screens and our home, we had already lost them as customers because “you never get a second chance to make a first impression”.
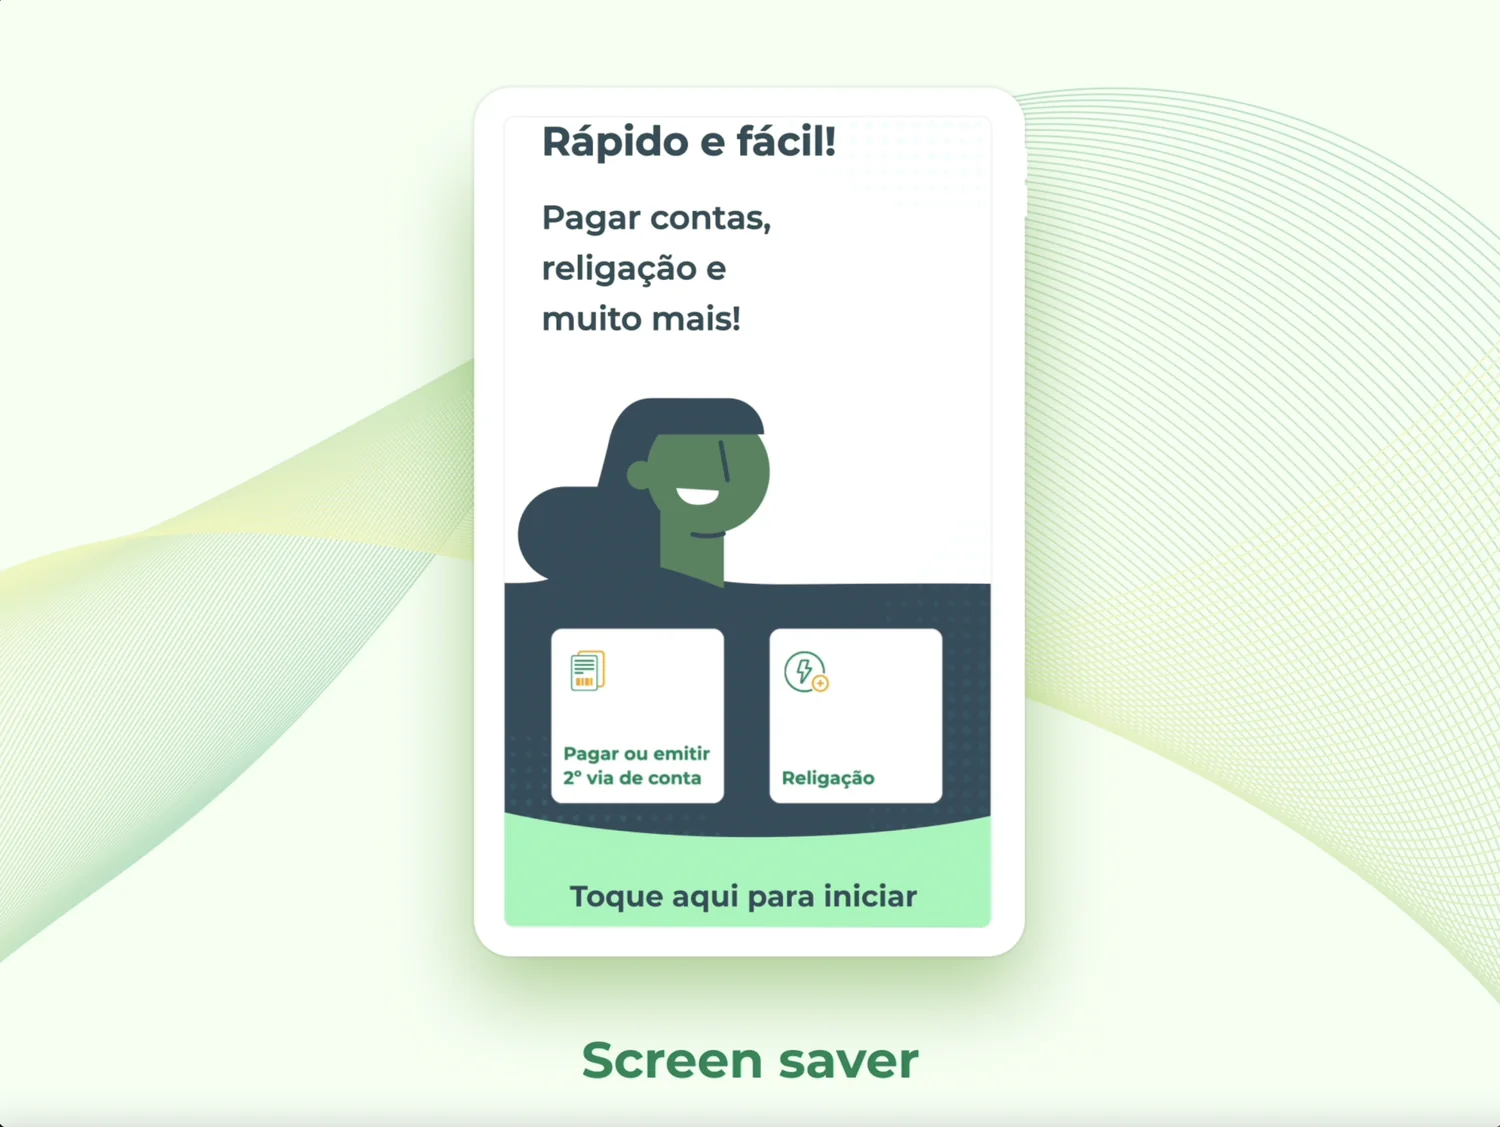
We knew an immediate win for the Cemig kiosk solution would be relooking at the screensaver and onboarding, which meant redesigning them with a lightweight/welcoming instructional video and an appealing home.
Besides that, the most challenging part about redesigning these 20 features was translating and modifying complex flows and structural information with technical terms into visual forms that are appealing for the users, and addressing all potential error states and edge cases that can occur during each functionality. We used concise and clear visuals to help them understand what was happening at each step and to guide them to resolve any errors.
Research
We shadowed and interviewed people using the kiosk stations for the first time to understand and learn their pain points. We visited many of the Cemig agencies ourselves to observe foot traffic and analyze what it’s like to be in the shoes of first-time users.
Research findings
Issue with contrast
Frustrated and felt unsure of what to do first due to the missing hierarchy
Hesitation to try out, due to the overabundance of information and the unnecessary elements
Screens seemed unresponsive
Pressure to understand the system right away
Overwhelmed by the length of the overall process
Evaluating the experience
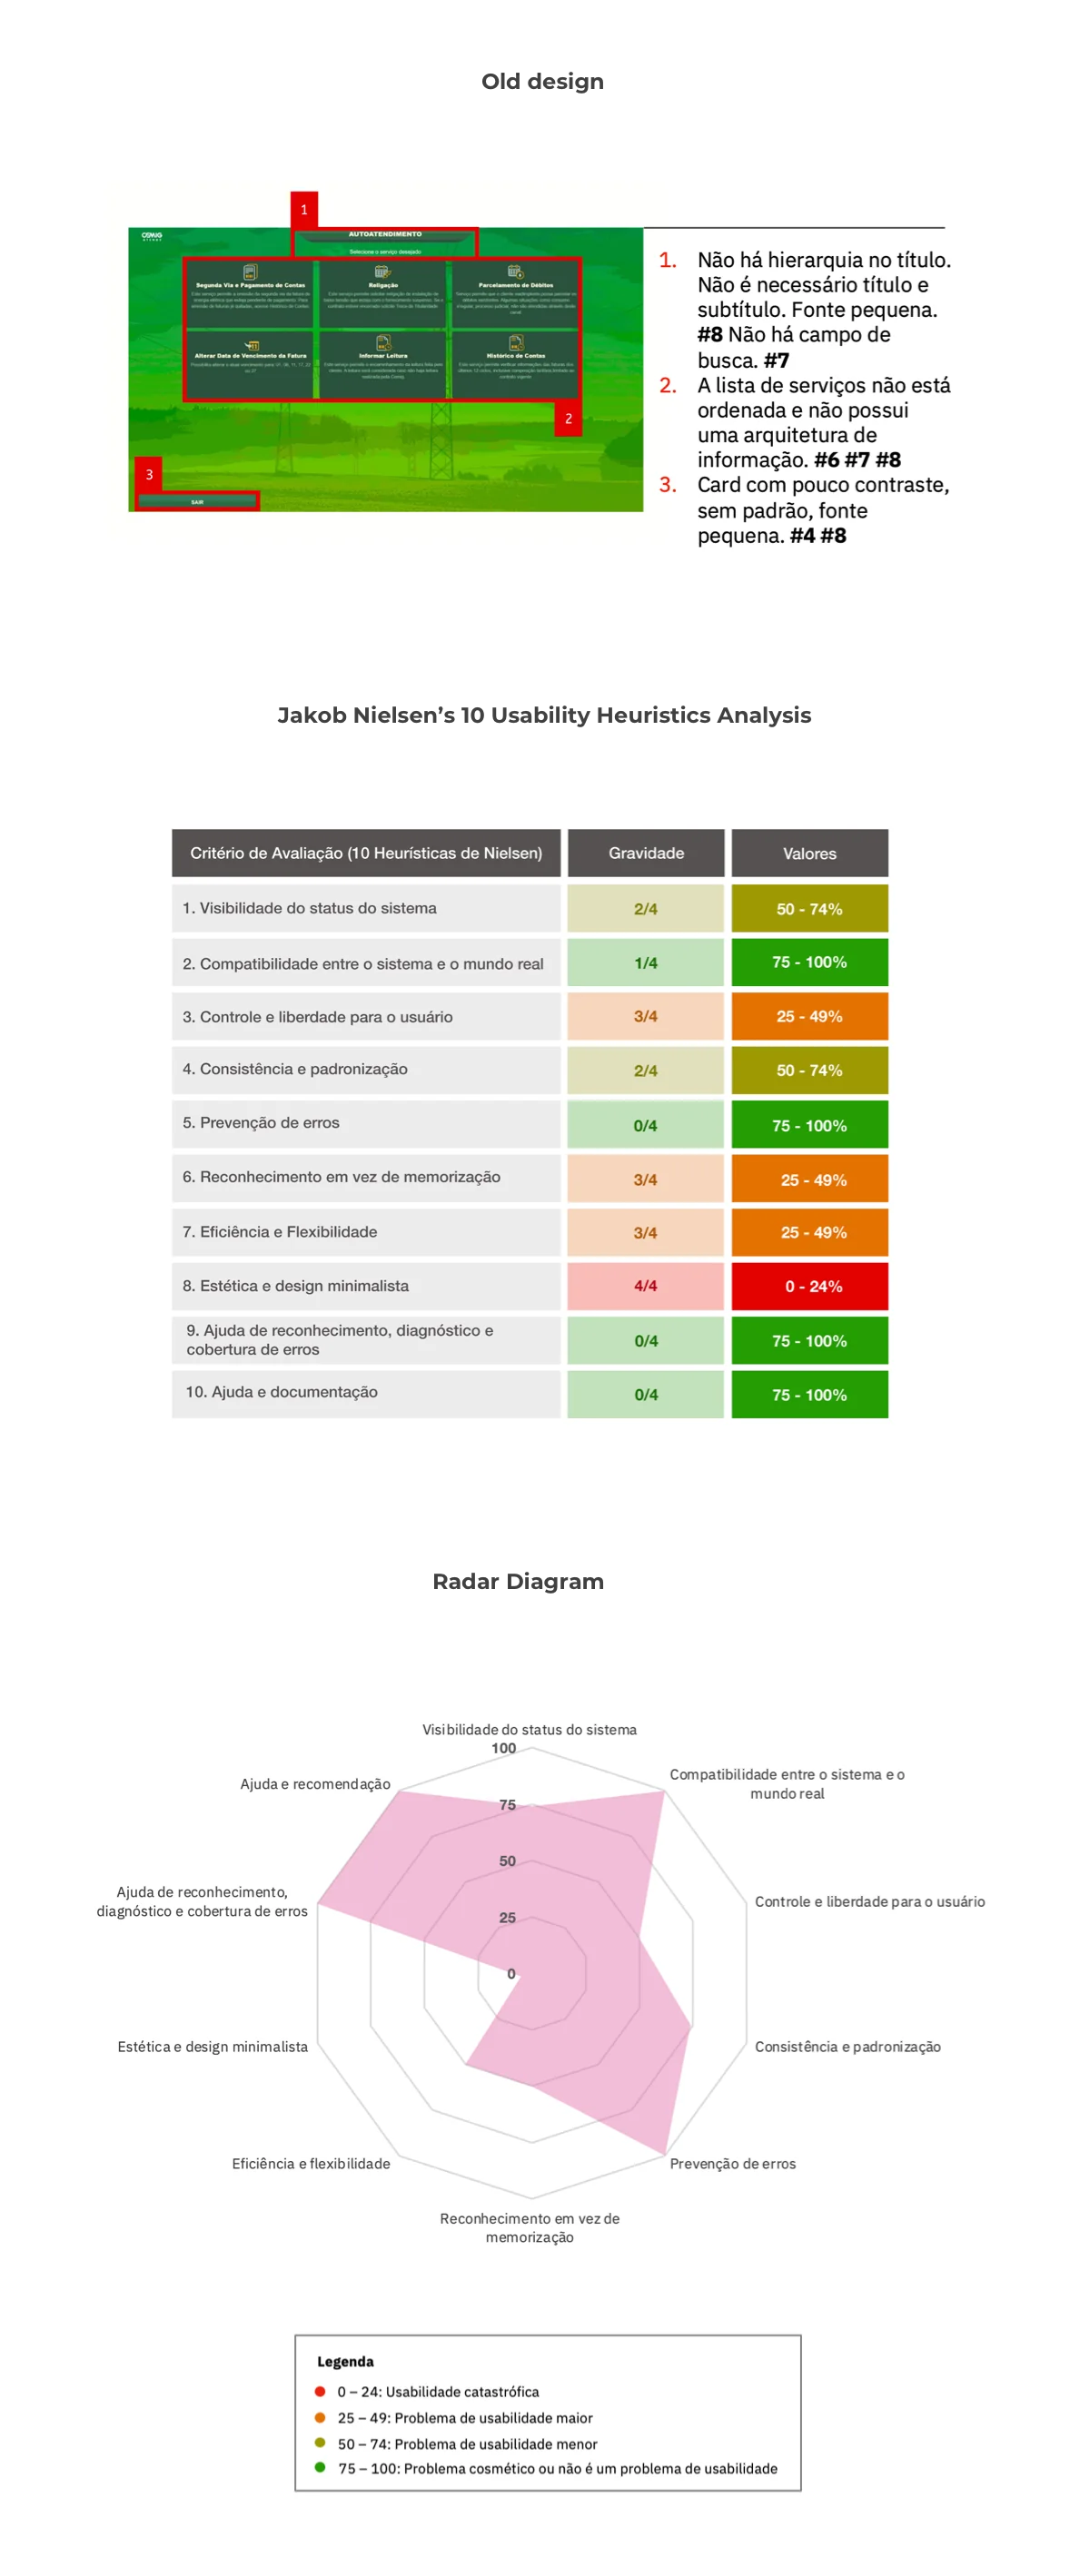
We assembled a team with professionals from adjacent areas to the design to perform possible real-life user tasks. As the items are evaluated, the team members assign scores based on principles and best usability practices. With results from our heuristics analysis, we reached the following radar chart, with the average of the evaluator’s scores:
At the end, we have percentages from each evaluator, meaning how much the kiosk meets those usability criteria, divided by categories. It is possible to observe that the most critical categories of the kiosk screens were:
Aesthetic and minimalist design
User control and freedom
Recognition rather than recall
Flexibility and efficiency of use
First deliverable
We shared our research findings and opportunities areas, as well as wireframes, mocks, and a heuristics analysis to Cemig stakeholders. The presentation culminated in two potential kiosk station customers and what a new onboarding experience onto Cemig kiosk stations could look like.
Customers
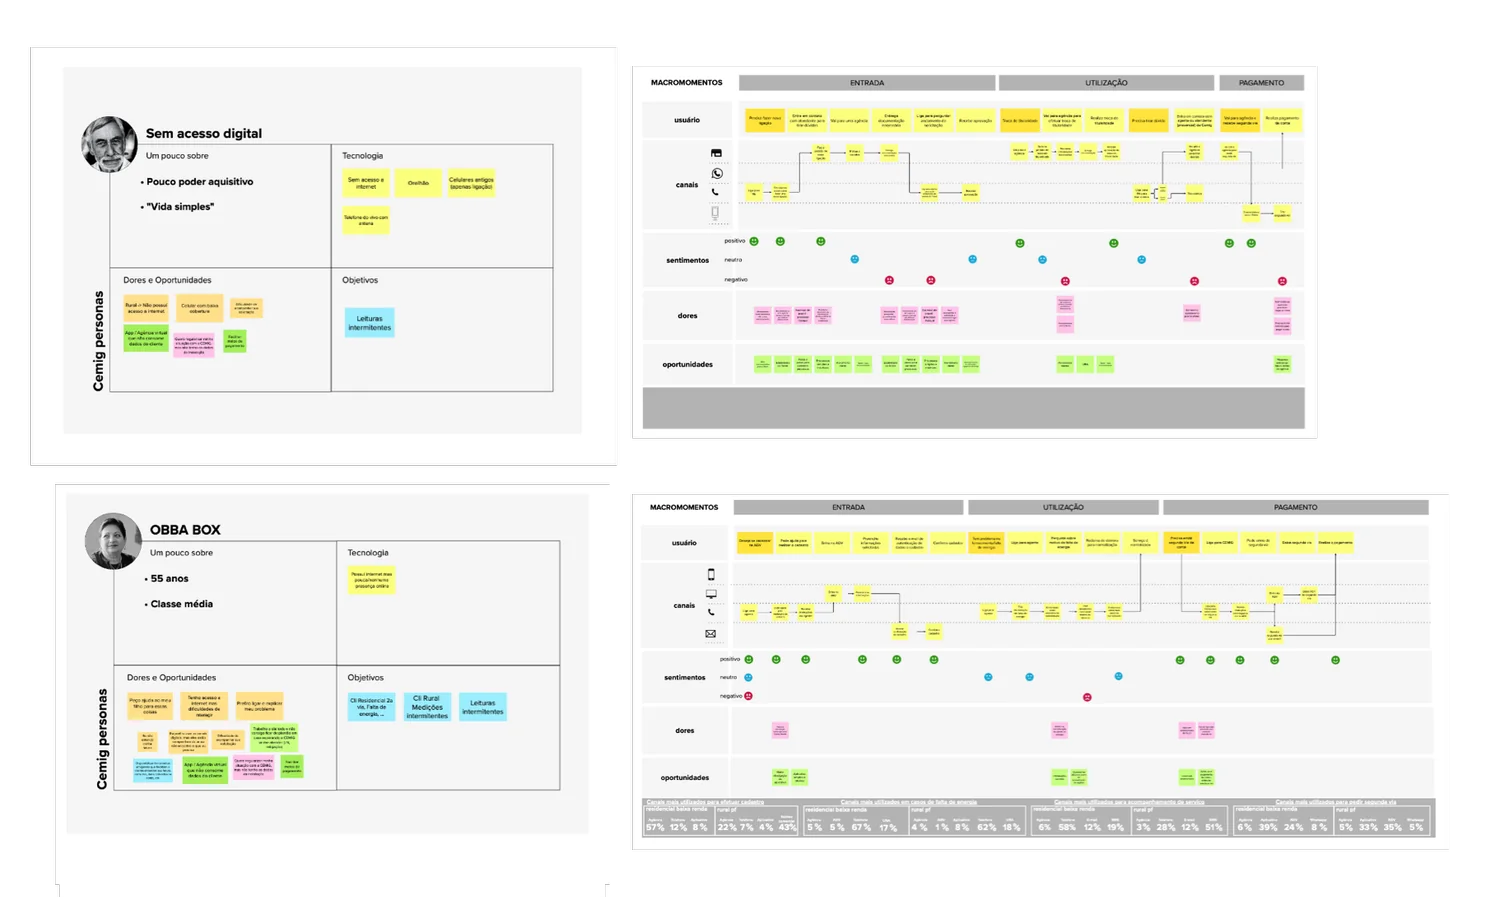
Personas and Journey Maps are small to omit confidential information
We observed that our main customers live in a rural area or are unfamiliar with technology in general. Most of them feel frustrated that they can’t use their mobile phone to solve problems due to the limited, inconsistent, and sporadic network coverage or lack of device storage to download apps. With that in mind, the kiosk stations would be a great solution to their needs.
We used personas constantly throughout the project to guide design decisions, priorities, and create empathy amongst the client and our team.
Onboarding
How it works
Feature design and development were broken into parallel workstreams for the channels mobile, website, and kiosk. I led the design for all aspects related to the kiosk stations solution.
Each feature phase of the kiosk was serialized in a 2-week sprint, starting with the design and development of APIs for the functionalities chosen. I followed by working with my team and the client’s experts to translate product features for the kiosk context into user flows (detailed conversion flow audits helped identify areas where the experience could be reduced and simplified) whilst working with user story mapping and gathering requirements with my platform engineering team to execute the current features through to completion.
Once each feature of the sprint was designed and approved by the key stakeholders, the engineering team began the implementation in another 2-week sprint. Concurrently, I would design the next functionalities and features in the pipeline.
The ‘Pagar conta’ (pay bills) flow on the redesigned kiosk
Working backwards from a fixed launch date meant that design was subsumed into an engineering-driven process. The kiosk station solution was driven by engineering estimates and the time to create the right design was the time left over. The combination of a fixed launch date and aggressive scope created an intense environment with many coordination and time challenges.
A design system and a physical product
I adapted IBM’s Carbon Design System to Cemig’s brand identity, which taught me a lot about keeping consistency and accessibility while customizing components inside a robust system.
I also worked with IBM’s ergonomics team so the kiosk was physically accessible to everyone: touchpoint height between 38 and 48 inches, screen tilt to reduce glare, reach zones for seated and standing users, and clear lines of sight. My background in industrial engineering helped me apply those principles to real-world constraints.
On screen, usability testing showed that people didn’t realize they could scroll on a kiosk. I moved the most used services to the top of the home and added pagination to make it obvious there was more.
Build for customers on the go
We developed a functionality called ‘Pagar conta’ (Pay bills). We simplified the process by minimizing the extra taps needed to accomplish the end goal, and at the same time, we implemented many payment options for users. The feedback we received from users was extremely positive, with many noting the convenience of having many payment options available, increasing the conversion rate by 40%.
Results
Early results exceeded our expectations. After the launch of the redesign of the Kiosk Stations, the median number of active customers increased by 68%.
Increased ‘Pagar conta’ (pay bills) functionality retention by 42%
Increased overall functionalities retention by 52%
Lines in the agency decreased in 31%
Takeaway
Spend more time with engineers! I learned that I should always build meaningful relationships with them that are more than just transactional. So I find ways to include them in the design process, I listen to their feedback and I learn how they build products. I realized that understanding the complexity and time it takes to implement my designs is extremely important. Why? A healthy relationship with the engineers always leads to stronger products and better craftsmanship. And besides that, they are a great source of innovation.
Premise — Report Insights
📌 I was the main designer leading this project in Q2 2022 – Q1 2023 ideating early concepts, running design sprints, presenting regularly to leadership, and delivering final assets for production.
Scope
New platform, MVP
Role
Main Designer
Team
2 PMs, 6 Engineers, 1 Designer
Time
Q2 2022 – Q1 2023
📌 I worked with multiple cross-functional teams that included 2 product managers, 6 engineers, and 1 designer.
Project Summary
Analysts on the customer side requested data information on various topics, and our Premise CSOS (Customer Success Operations Specialists) team handled the Request for Information process through setting up forms, campaigns, and exporting data from multiple system applications to deliver a product in a format that customer analysts can include in their briefings. This project aimed to make our team members’ work easier by providing tools that enable rapid insight generation and delivery, thereby increasing the Request for Information process velocity. By doing so, we could improve our customer experience and meet their expectations in a timely manner.
Business problem
CSOS (Customer Success Operations Specialists) team was struggling to make fast and digestible product with analytical insights, and this led to:
Increase in time to produce and build deliverables products according to the customer’s specific needs, which was hindering our product’s scalability
Customer disengagement and hesitant to collaborate with our team members during the report production because they felt overwhelmed with the amount of raw data from the tools we used
How did CSOS produce insights?
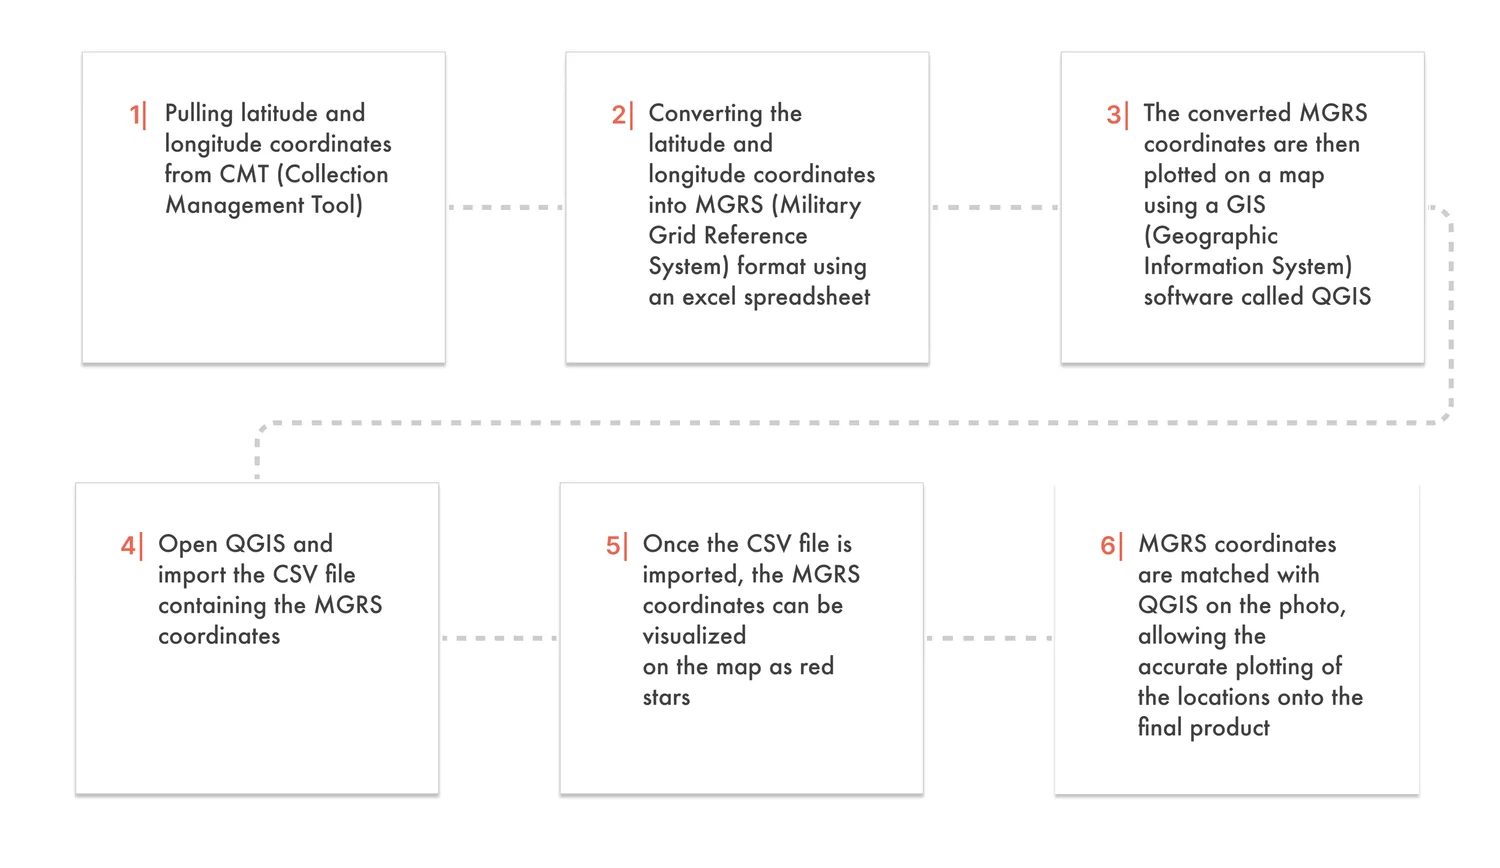
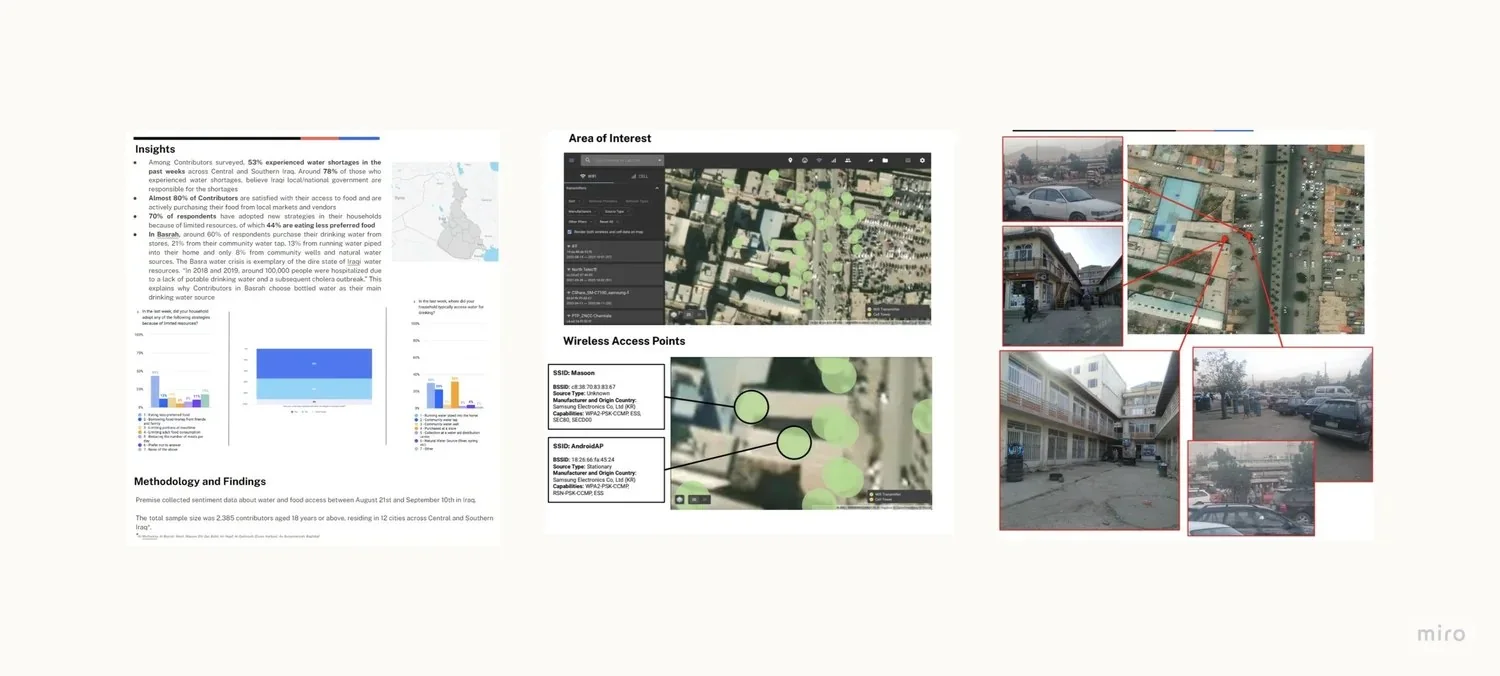
This flow involved multiple steps to plot locations from data onto a map in the final product. Here’s a more detailed description of each step:
Overall, this flow involved converting coordinates, visualizing them on a map, and matching them with a photo to plot onto the final product. This process required knowledge of GIS software and coordinate systems, as well as attention to detail to ensure the accurate placement of the locations on the final product.
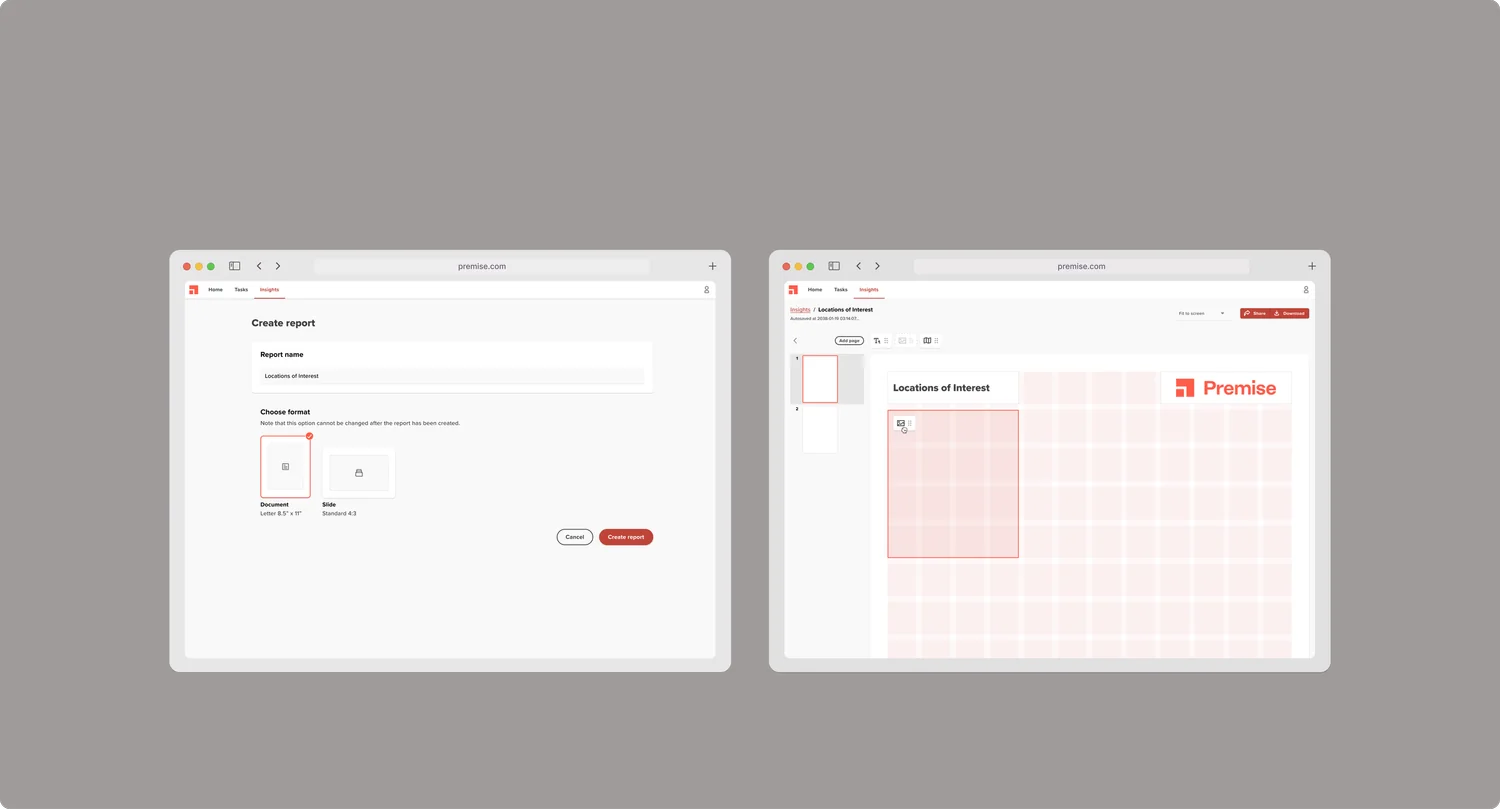
Final product
How should CSOS produce insights?
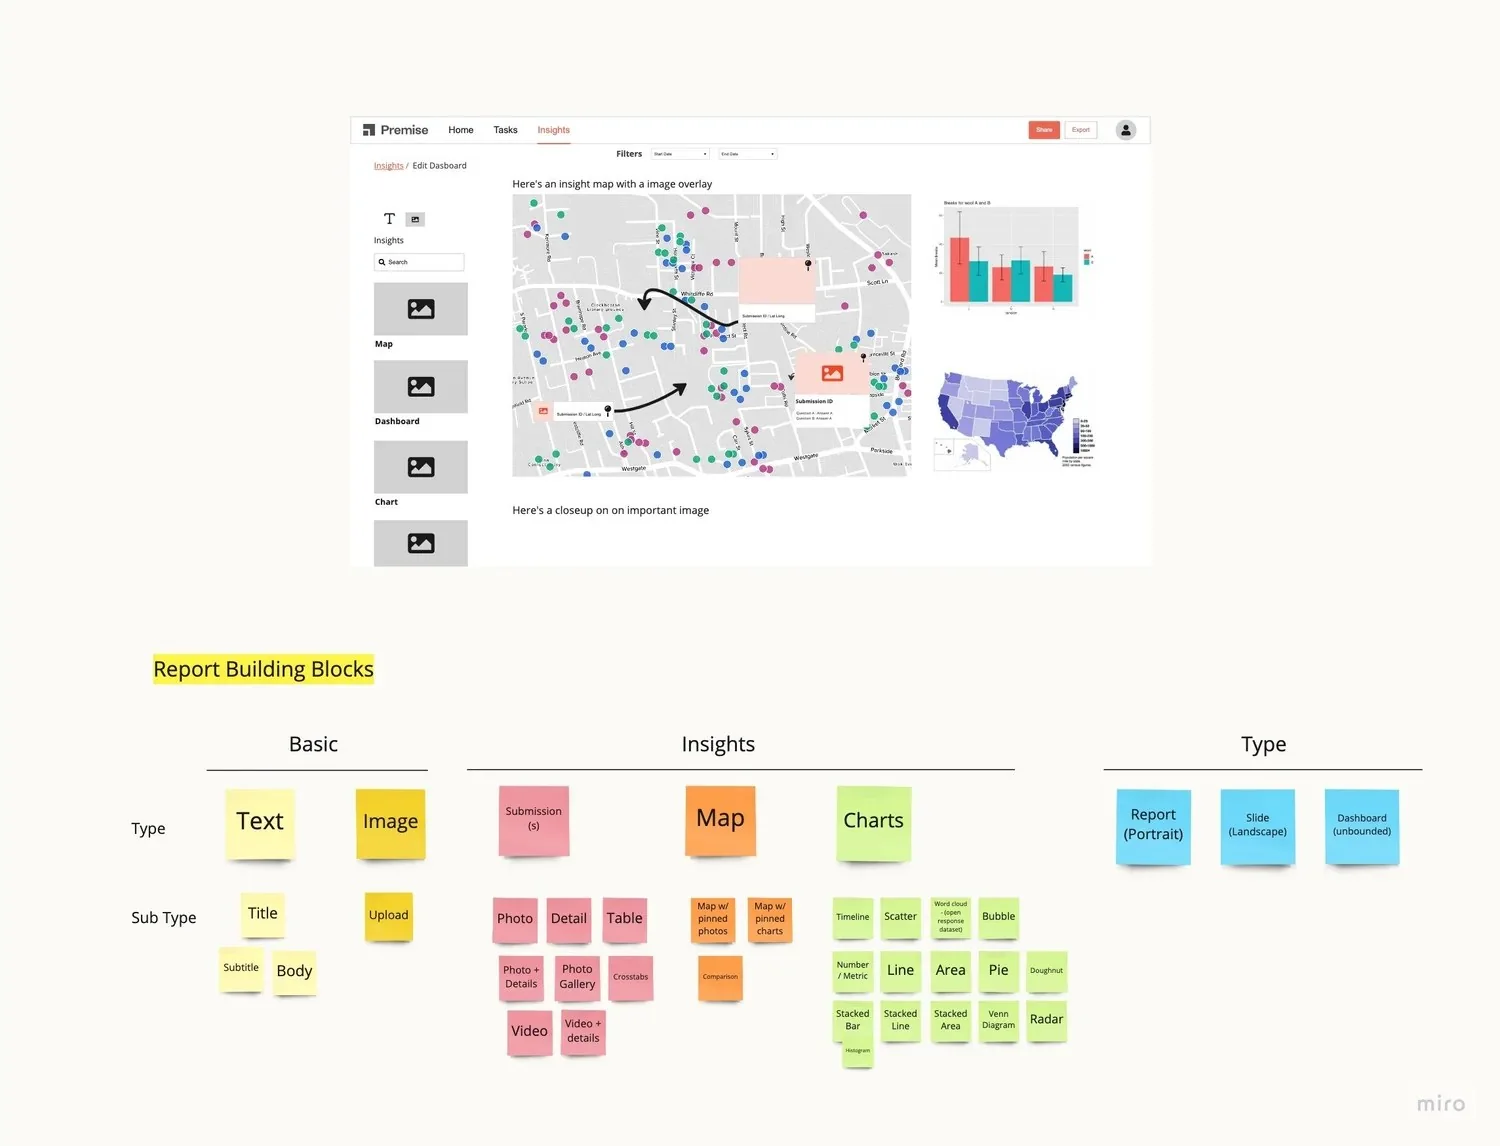
Ideally, CSOS team shouldn’t be creating deliverable products across multiple platforms. Premise didn’t have any sort of report insights builder, or an efficient way for customers to reach out to CSOS about their products. To overcome these issues, we proposed to create a seamless platform that could integrate with any data insight of the ecosystem, facilitating the growth and scalability of the report system across all Premise data insights.
This platform would serve as a centralized hub for our team to build analytical reports, and for customers to easily visualize and collaborate regardless of whether the needs and widgets such as images, texts, charts, maps, dashboards, etc. In our first round of outreach, we received immediate interest from CSOS, Customer Leaders, Global Ops Leaders and Client Analytics Leaders.
First ideation
Project Goals
Create value for both CSOS and customers — decrease the CSOS team’s report build time from a 2-week duration to an efficient 2-day turnaround
Streamline our data processing methods in order to provide a product that is easily understandable and actionable for our CSOS team and customers
Address all possible concerns when moving from third party tools to Premise tools
Ensure complete transparency and trust for both parties throughout the entire process in order to foster collaboration between them
Use research to determine the appropriate priorities of the product and users
Process
Key Focus Areas
Will CSOS use our tool over other third party tools?
Does CSOS think it will save them time and make their job easier?
Is CSOS able to create reports easily and intuitively?
What’s the range of potential use cases for CSOS across different customers?
Will customers want to collaboratively work on reports with CSOS?
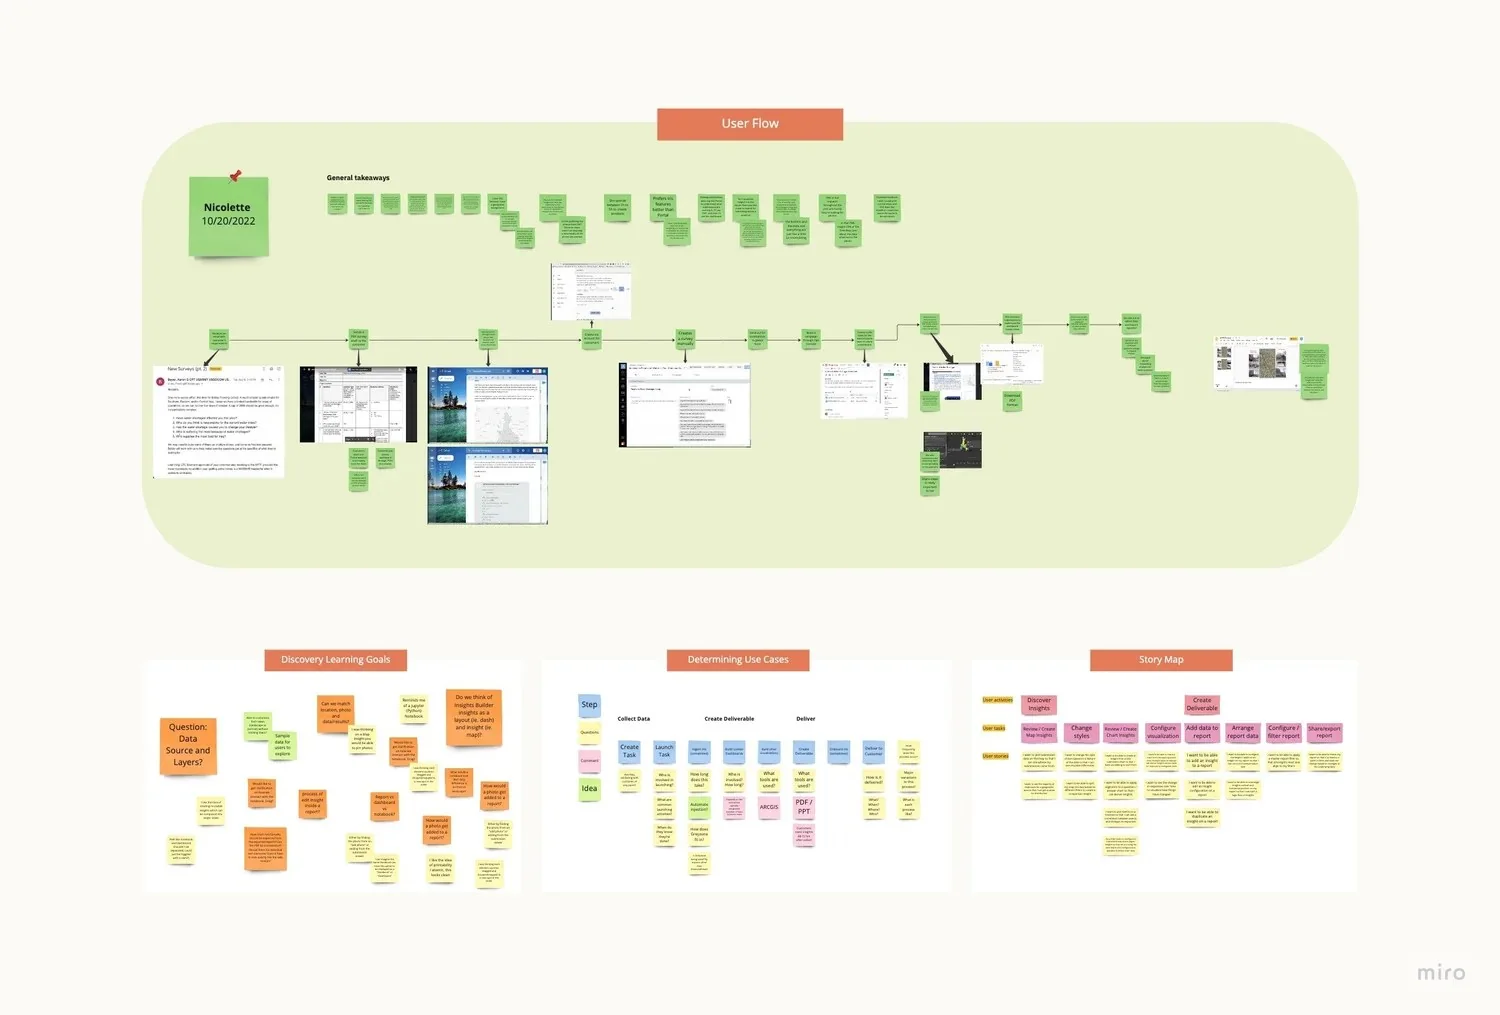
Cross-functional workshop across PM, CSOS, Designers, and Engineers
Design Principles
Design Iterations: Learning from users
I went through the following steps:
Identify which team would have the most pressing need for reports, set up syncs and briefings with leaders
High-fidelity designs — bring what we can offer to the table, as well as a hypothesis for how reports would benefit and improve their product
Receive feedback on the designs as to what is relevant, what is missing, what else they’d like to see
Update designs, and plan out the MVP and ideal state phases and specifications
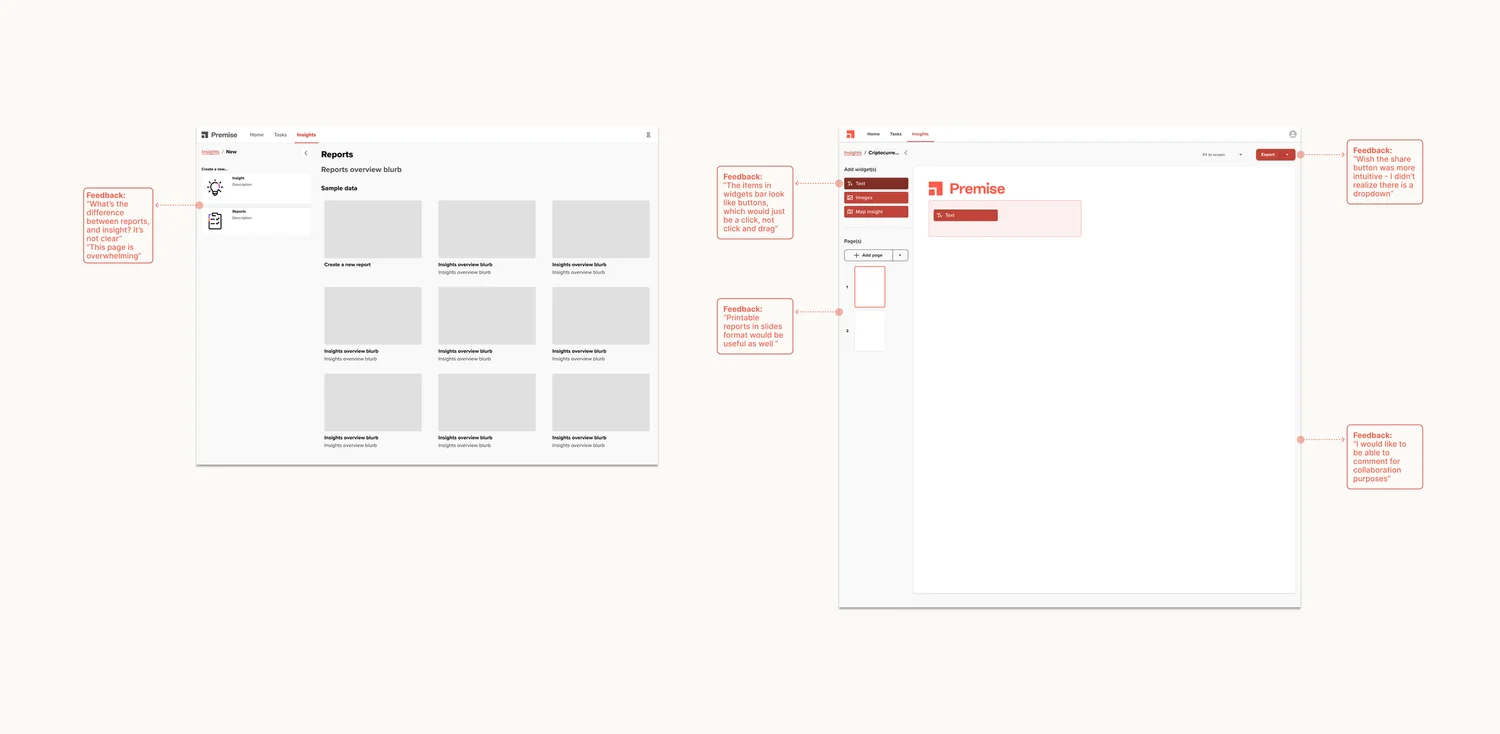
Feedback
Aesthetic and minimalist design: our existing reports creation process was for power users. Simplify the designs to not overwhelm the CSOS and customers who are unfamiliar with raw data content experience.
Consistency and standards: I received feedback from other teams on how patterns differ from theirs. I modified my designs to stay consistent with their standards components.
Constraints: We received feedback from users expressing a desire for advanced features and functionalities. However, due to technical constraints, I was unable to include these features in the final design. These constraints included limitations in available resources and software, which made it impossible to implement certain features without negatively impacting the user experience or system stability.
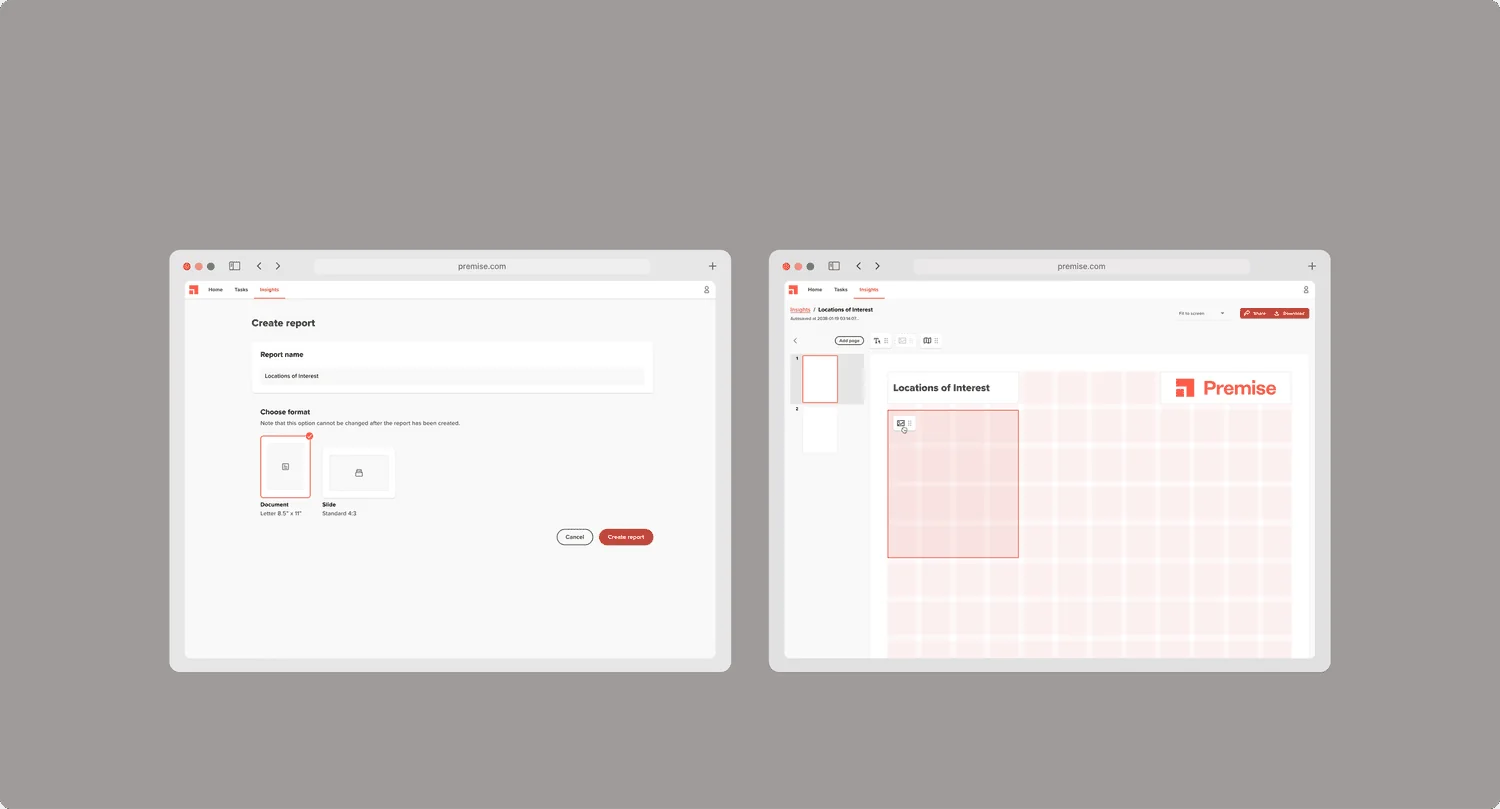
MVP Design
After several more rounds of reviews with stakeholders, we determined the best path forward for the MVP stage.
The plan: offer a very limited set of features to a small number of CSOS to enable report insights creation, then release a more comprehensive design to a larger group after additional research and testing.
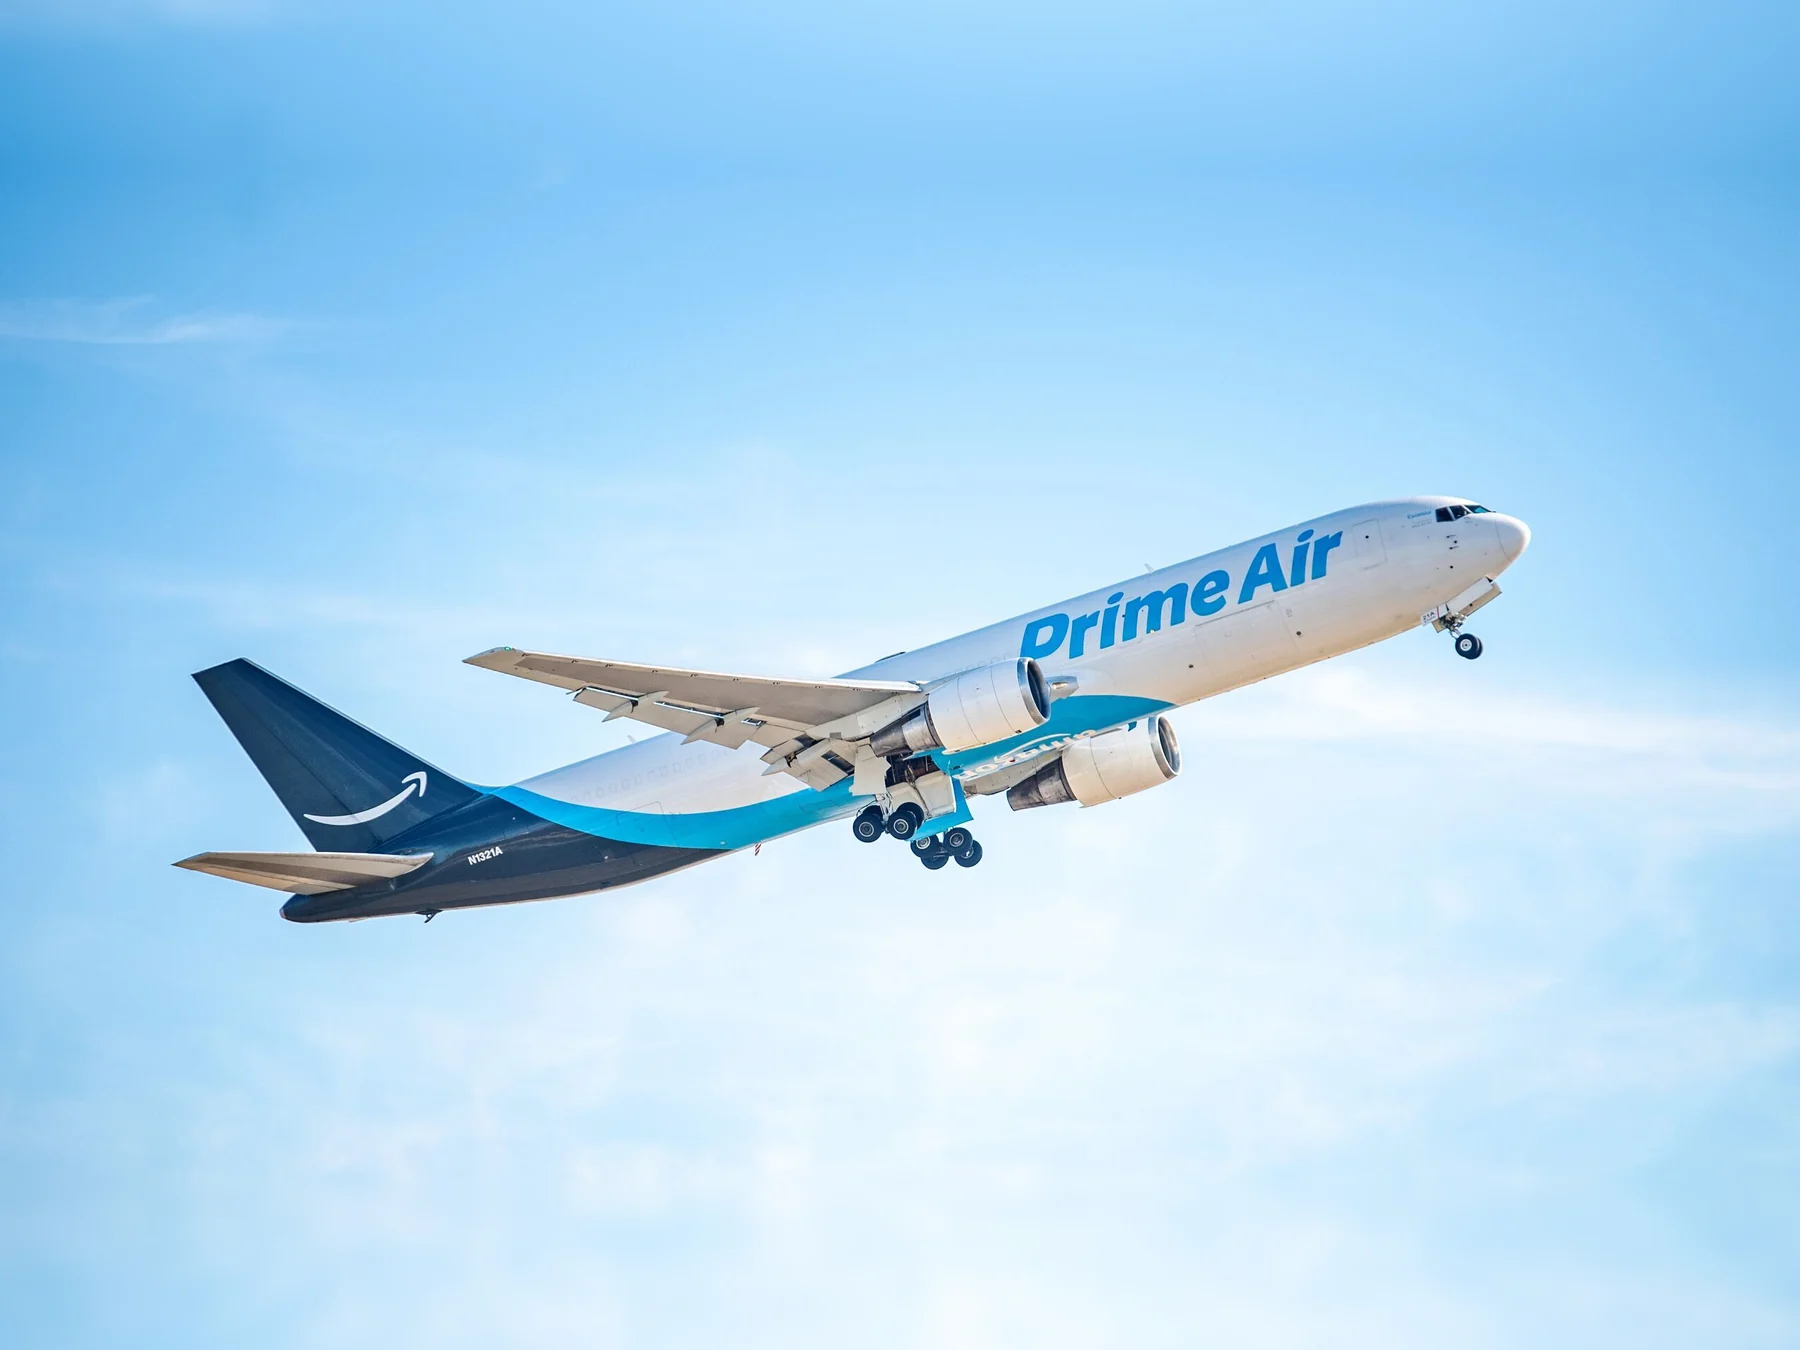 Amazon AirDisruption management for air cargo operations
 Alaska AirlinesMxHub, a dashboard for maintenance technicians
 IBM ConsultingCemig kiosk stations redesign
 Premise DataReport Insights platform